Introduction #
The Pascal Visual Object Classes (VOC) Challenge has been an annual event since 2006. The challenge consists of two components: (i) a publicly available dataset of images obtained from the Flickr web site, together with ground truth annotation and standardised evaluation software; and (ii) an annual competition and workshop. The most popular part of the dataset is segmentation, which is presented on the DatasetNinja.
There are three principal challenges: classification — “does the image contain any instances of a particular object class?” (where object classes include cars, people, dogs, etc.), detection — “where are the instances of a particular object class in the image (if any)?”, and segmentation — “to which class does each pixel belong?”. In addition, there are two subsidiary challenges (tasters): action classification — “what action is being performed by an indicated person in this image?” (where actions include jumping, phoning, riding a bike, etc.) and person layout — “where are the head, hands and feet of people in this image?”. The challenges were issued with deadlines each year, and a workshop held to compare and discuss that year’s results and methods.
Summary #
PASCAL Visual Object Classes Challenge 2012 (Segmentation Part) is a dataset for instance segmentation, semantic segmentation, and object detection tasks. It is applicable or relevant across various domains.
The dataset consists of 7282 images with 19694 labeled objects belonging to 21 different classes including neutral, person, chair, and other: car, cat, dog, bird, bottle, sofa, aeroplane, pottedplant, train, diningtable, motorbike, tvmonitor, bus, boat, horse, bicycle, cow, and sheep.
Images in the PASCAL VOC 2012 dataset have pixel-level instance segmentation annotations. Due to the nature of the instance segmentation task, it can be automatically transformed into a semantic segmentation (only one mask for every class) or object detection (bounding boxes for every object) tasks. There are 1456 (20% of the total) unlabeled images (i.e. without annotations). There are 4 splits in the dataset: trainval (2913 images), train (1464 images), test (1456 images), and val (1449 images). The dataset was released in 2012 by the UK joint research group.
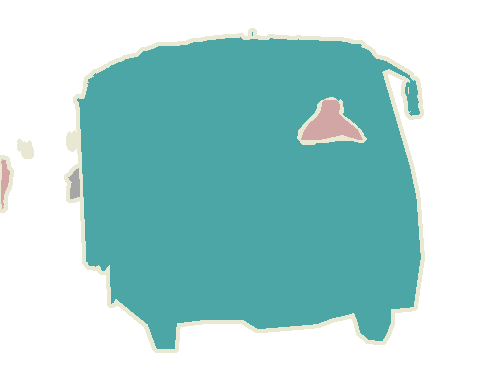
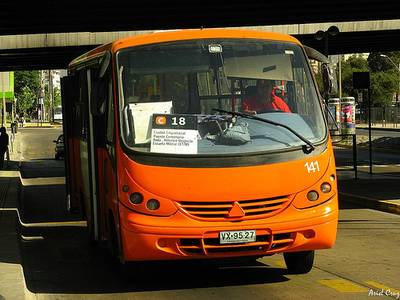
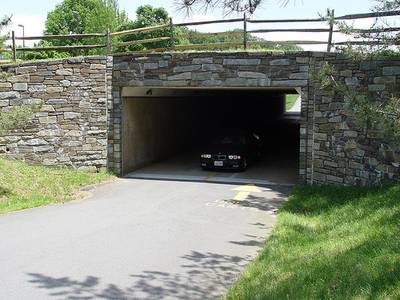
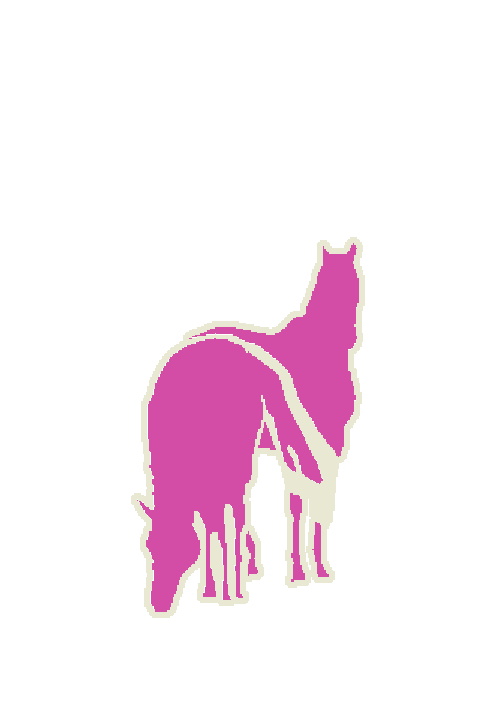
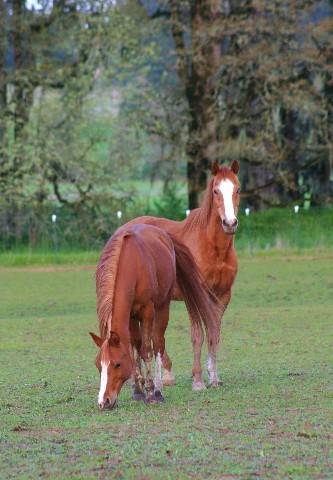
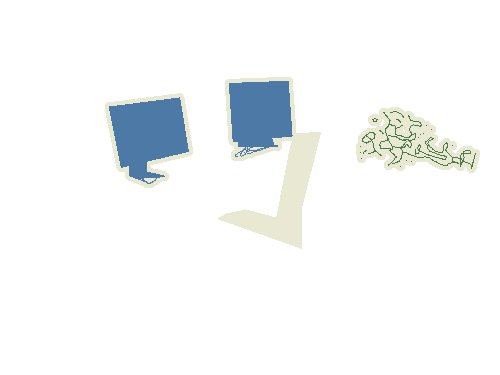
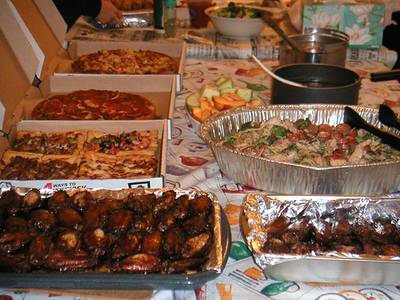
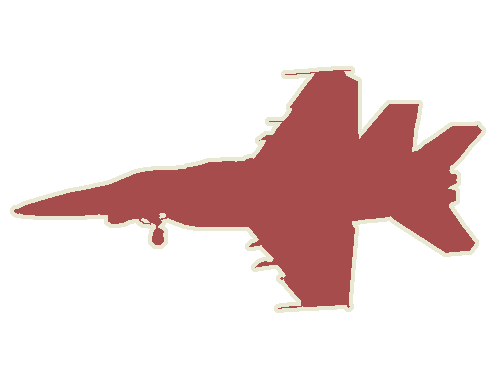
Here are the visualized examples for the classes:
Expert Insights #
At Supervisely, we make machine learning tools to leverage data and gain insights into production-level neural networks. Here are a few things our professional data scientists have to say:
-
Pascal VOC 2012 dataset is widely used as a benchmark for different computer vision tasks like semantic segmentation, instance segmentation and object detection. However, according to the Leaderboards for the Evaluations on PASCAL VOC Data the most popular and traditional competition for this dataset is the semantic segmentation task (authors name it as object segmentation task). In addition, the most common benchmark for object detection and instance segmentation is the COCO dataset.
-
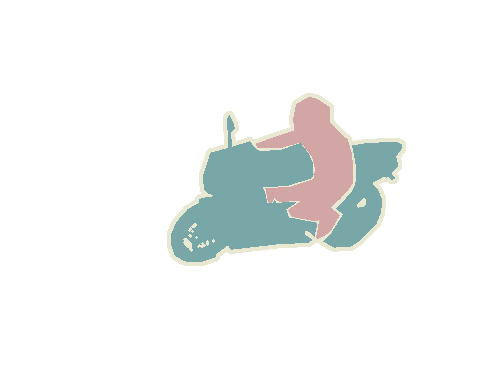
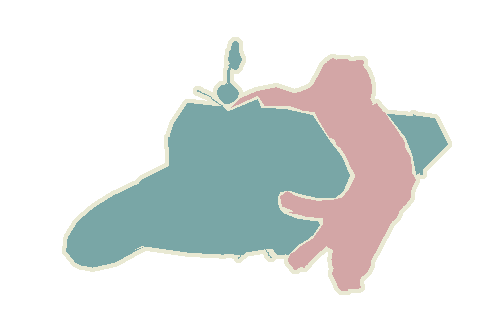
Another interesting aspect of this dataset is the presence of a neutral class. The boundary (internal and external pixels nearby the object edge) of every segmentation mask is marked with the special neutral class. It is worth noting that the neutral mask is presented as a single mask for all objects on the image (i.e. authors of the dataset do not provide separate neutral masks for every object).
Traditionally, a neutral class is used during neural network training - all pixels marked with this class do not take into account in training loss calculation. It allows to manually label object boundaries with less precision. Nowadays, this approach is not so popular thanks to the development of interactive tools that significantly speed up manual labeling and provide high-quality pixel-level segmentation. Here is an example of fast and accurate interactive segmentation tools in the Computer Vision platform Supervisely:
-
This dataset is one of the most famous in Computer Vision and almost all deep learning libraries and frameworks support the data in its format out of the box. For example MMSegmentation toolbox
. Also, most of the state-of-the-art neural network architectures for semantic segmentations have pretrained weights on Pascal VOC for transfer learning and faster model convergence during training. You can train a custom semantic segmentation model with this user-friendly training app in just a few clicks.
-
The images in the dataset exhibit a variety of scene types, lighting conditions, camera angles, and object shapes. Thus, Pascal VOC benchmark is quite challenging for Machine Learning researchers in comparison with other semantic segmentation benchmarks, like Cityscapes where image scenes are visually similar.
Explore #
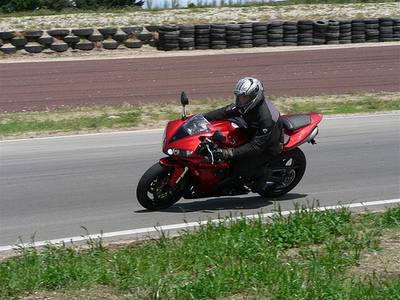
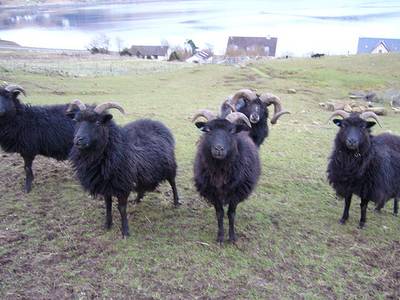
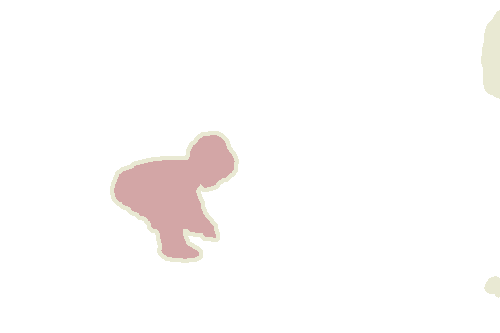
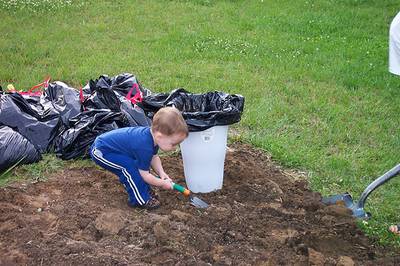
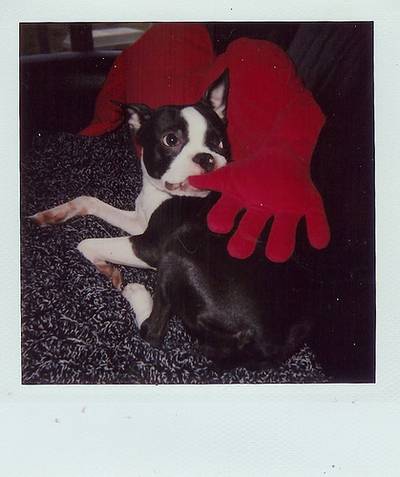
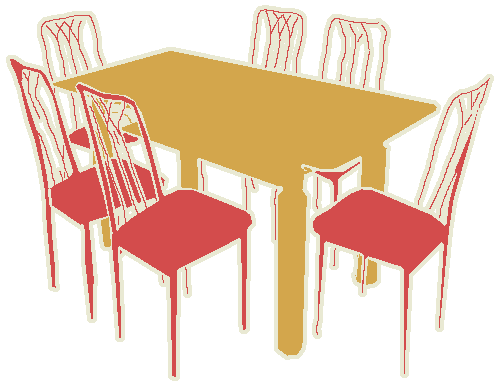
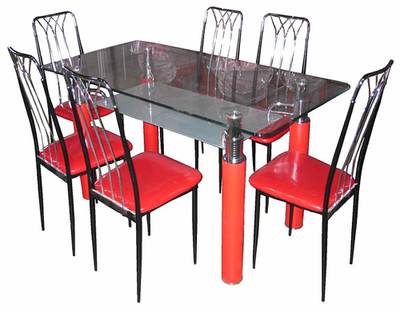
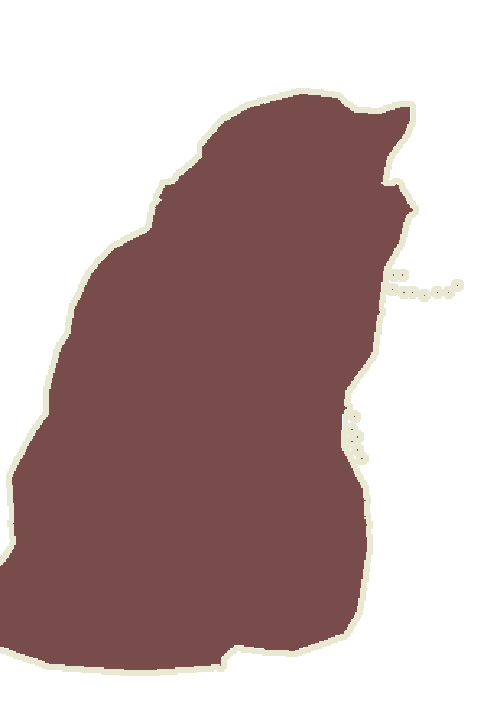
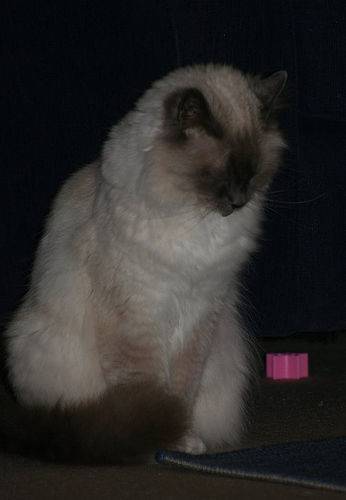
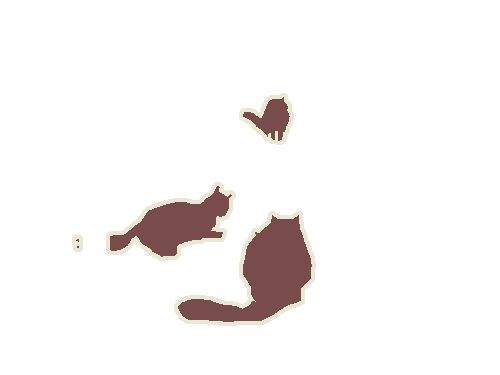
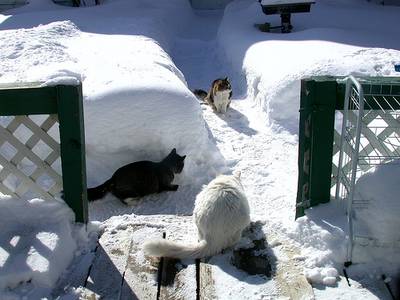
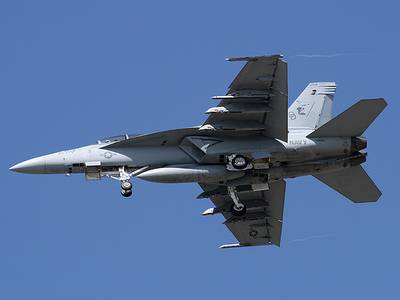
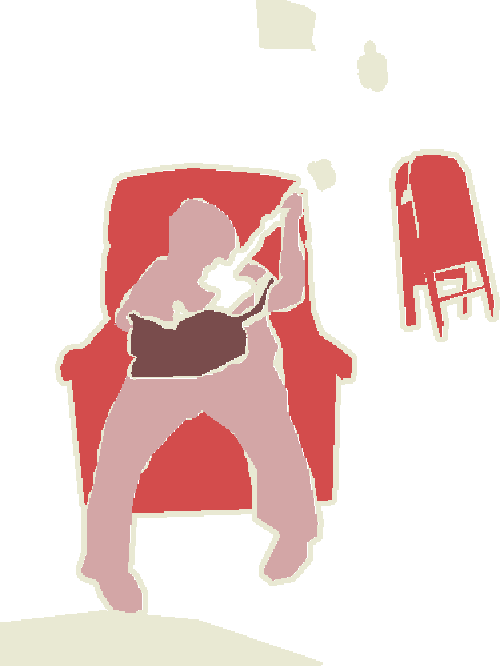
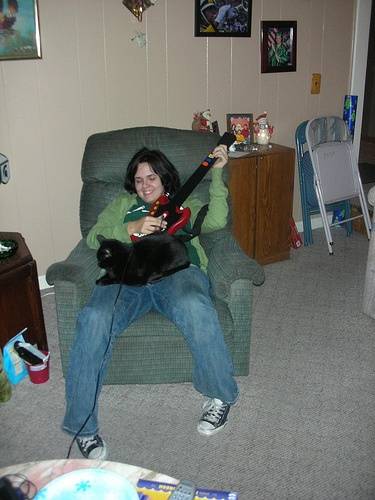
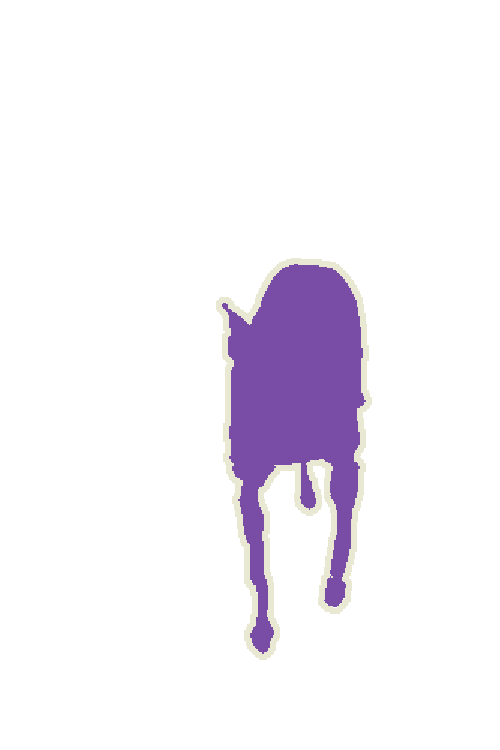
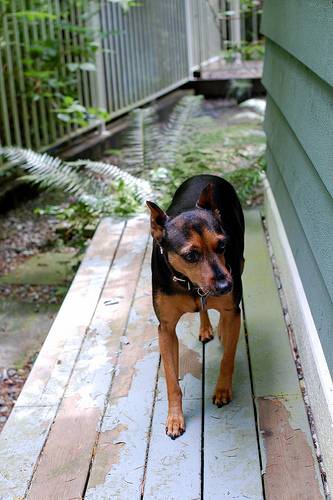
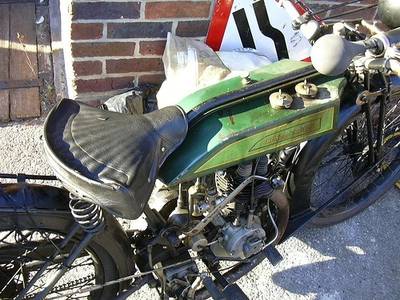
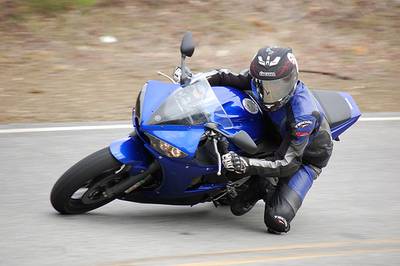
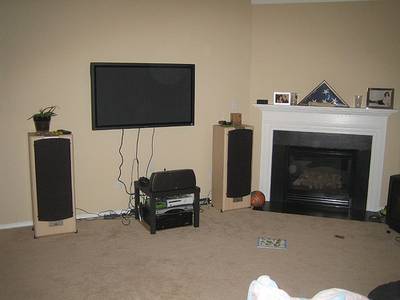
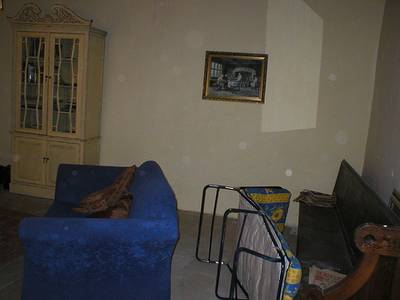
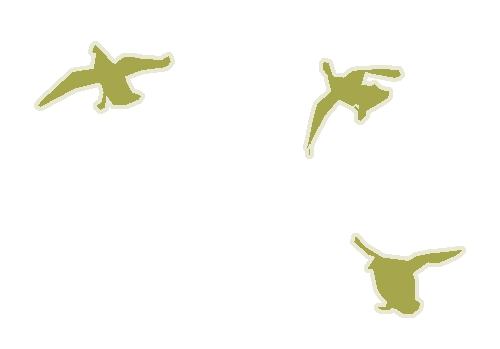
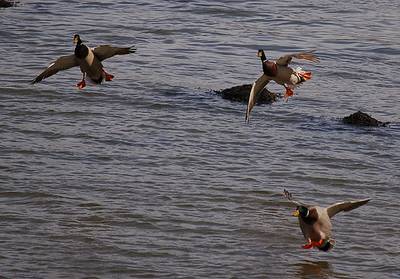
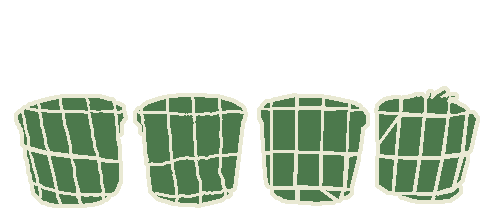
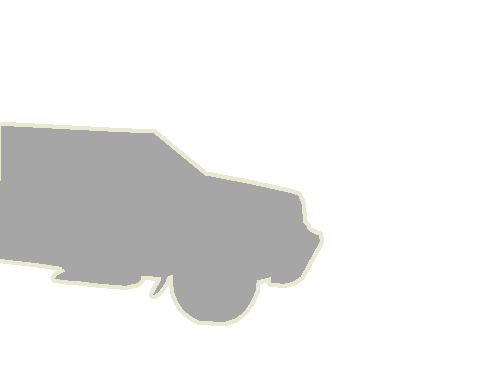
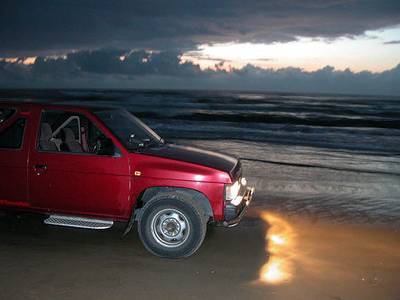
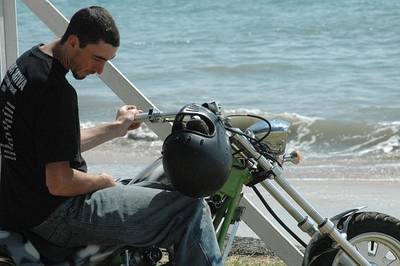
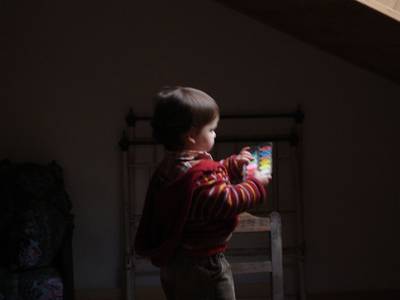
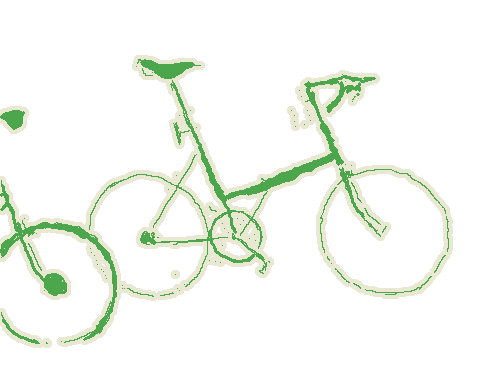
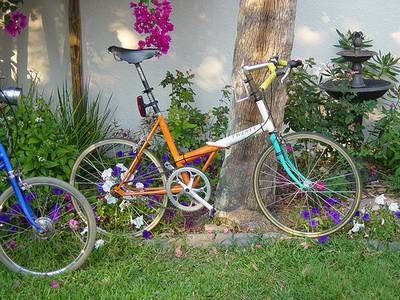
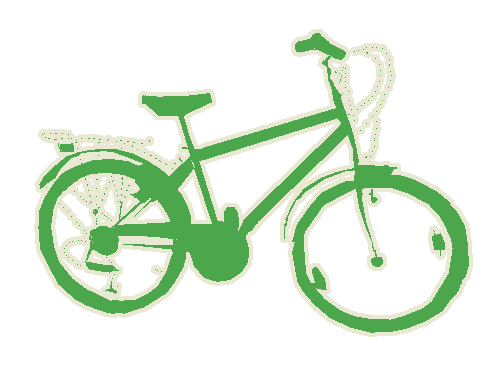
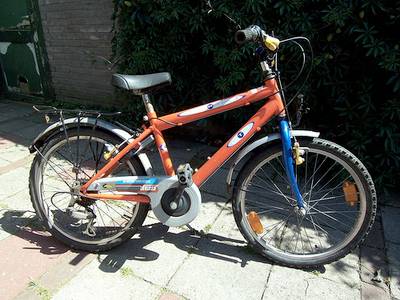
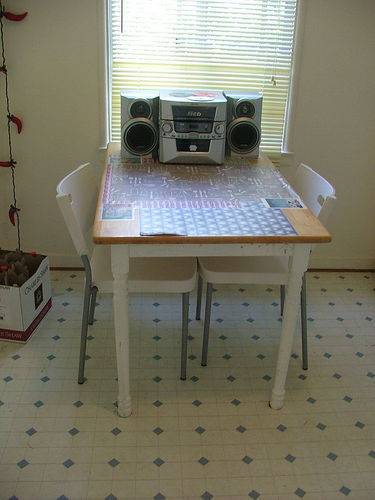
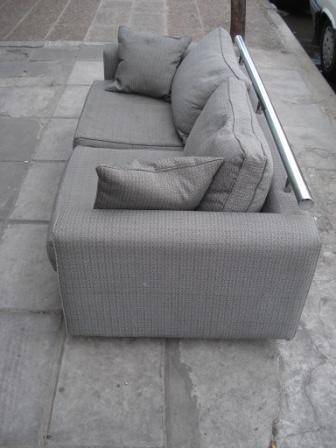
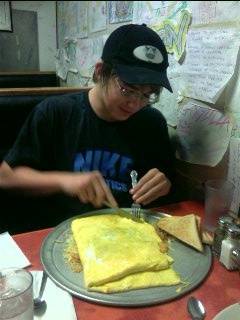
PASCAL VOC 2012 dataset has 7286 images. Click on one of the examples below or open "Explore" tool anytime you need to view dataset images with annotations. This tool has extended visualization capabilities like zoom, translation, objects table, custom filters and more. Hover the mouse over the images to hide or show annotations.
















Class balance #
There are 21 annotation classes in the dataset. Find the general statistics and balances for every class in the table below. Click any row to preview images that have labels of the selected class. Sort by column to find the most rare or prevalent classes.
Class ㅤ | Images ㅤ | Objects ㅤ | Count on image average | Area on image average |
|---|---|---|---|---|
neutral➔ mask | 5826 | 5826 | 1 | 5.5% |
person➔ mask | 1776 | 3476 | 1.96 | 15.75% |
chair➔ mask | 542 | 1100 | 2.03 | 10.27% |
car➔ mask | 510 | 914 | 1.79 | 15.88% |
cat➔ mask | 500 | 572 | 1.14 | 27.44% |
dog➔ mask | 498 | 598 | 1.2 | 20.77% |
bird➔ mask | 416 | 554 | 1.33 | 11.5% |
sofa➔ mask | 366 | 418 | 1.14 | 21.62% |
bottle➔ mask | 366 | 714 | 1.95 | 10.55% |
aeroplane➔ mask | 356 | 436 | 1.22 | 12.19% |
Co-occurrence matrix #
Co-occurrence matrix is an extremely valuable tool that shows you the images for every pair of classes: how many images have objects of both classes at the same time. If you click any cell, you will see those images. We added the tooltip with an explanation for every cell for your convenience, just hover the mouse over a cell to preview the description.
Images #
Explore every single image in the dataset with respect to the number of annotations of each class it has. Click a row to preview selected image. Sort by any column to find anomalies and edge cases. Use horizontal scroll if the table has many columns for a large number of classes in the dataset.
Object distribution #
Interactive heatmap chart for every class with object distribution shows how many images are in the dataset with a certain number of objects of a specific class. Users can click cell and see the list of all corresponding images.
Class sizes #
The table below gives various size properties of objects for every class. Click a row to see the image with annotations of the selected class. Sort columns to find classes with the smallest or largest objects or understand the size differences between classes.
Class | Object count | Avg area | Max area | Min area | Min height | Min height | Max height | Max height | Avg height | Avg height | Min width | Min width | Max width | Max width |
|---|---|---|---|---|---|---|---|---|---|---|---|---|---|---|
neutral mask | 5826 | 5.5% | 91.61% | 0.17% | 19px | 4.4% | 500px | 100% | 260px | 67.49% | 21px | 4.2% | 500px | 100% |
person mask | 3476 | 8.05% | 75.83% | 0% | 5px | 1.22% | 500px | 100% | 176px | 45.86% | 1px | 0.2% | 500px | 100% |
chair mask | 1100 | 5.06% | 76.29% | 0.03% | 9px | 1.8% | 500px | 100% | 146px | 37.3% | 9px | 1.8% | 500px | 100% |
car mask | 914 | 8.86% | 78.51% | 0% | 2px | 0.53% | 467px | 97.07% | 89px | 24.5% | 4px | 0.8% | 500px | 100% |
bottle mask | 714 | 5.41% | 71.29% | 0.03% | 9px | 2.41% | 500px | 100% | 133px | 32.07% | 3px | 0.6% | 500px | 100% |
pottedplant mask | 644 | 5.06% | 92.33% | 0.01% | 7px | 2.13% | 499px | 100% | 130px | 32.92% | 6px | 1.4% | 500px | 100% |
sheep mask | 616 | 7.44% | 61.94% | 0% | 3px | 0.6% | 470px | 100% | 127px | 33.6% | 2px | 0.53% | 483px | 96.6% |
dog mask | 598 | 17.29% | 89.56% | 0.33% | 26px | 6% | 496px | 100% | 213px | 55.46% | 37px | 8% | 500px | 100% |
cat mask | 572 | 23.99% | 94.79% | 0.22% | 31px | 8.27% | 500px | 100% | 247px | 62.17% | 29px | 5.8% | 500px | 100% |
cow mask | 568 | 9.96% | 60.38% | 0.04% | 6px | 1.91% | 498px | 100% | 147px | 39.73% | 10px | 2% | 500px | 100% |
Spatial Heatmap #
The heatmaps below give the spatial distributions of all objects for every class. These visualizations provide insights into the most probable and rare object locations on the image. It helps analyze objects' placements in a dataset.

Objects #
Table contains all 19694 objects. Click a row to preview an image with annotations, and use search or pagination to navigate. Sort columns to find outliers in the dataset.
Object ID ㅤ | Class ㅤ | Image name click row to open | Image size height x width | Height ㅤ | Height ㅤ | Width ㅤ | Width ㅤ | Area ㅤ |
|---|---|---|---|---|---|---|---|---|
1➔ | chair mask | 2008_000673.jpg | 213 x 320 | 183px | 85.92% | 245px | 76.56% | 22.95% |
2➔ | person mask | 2008_000673.jpg | 213 x 320 | 190px | 89.2% | 268px | 83.75% | 20.44% |
3➔ | person mask | 2008_000673.jpg | 213 x 320 | 81px | 38.03% | 94px | 29.38% | 4.83% |
4➔ | neutral mask | 2008_000673.jpg | 213 x 320 | 194px | 91.08% | 320px | 100% | 9.23% |
5➔ | chair mask | 2011_002709.jpg | 290 x 500 | 282px | 97.24% | 482px | 96.4% | 40.13% |
6➔ | person mask | 2011_002709.jpg | 290 x 500 | 286px | 98.62% | 499px | 99.8% | 33.34% |
7➔ | neutral mask | 2011_002709.jpg | 290 x 500 | 290px | 100% | 500px | 100% | 20.03% |
8➔ | sheep mask | 2009_004070.jpg | 375 x 500 | 39px | 10.4% | 58px | 11.6% | 0.8% |
9➔ | neutral mask | 2009_004070.jpg | 375 x 500 | 47px | 12.53% | 66px | 13.2% | 0.43% |
10➔ | person mask | 2007_007415.jpg | 375 x 500 | 18px | 4.8% | 7px | 1.4% | 0.04% |
License #
The VOC data includes images obtained from the “flickr” website. Use of these images must respect the corresponding terms of use:
For the purposes of the challenge, the identity of the images in the database, e.g. source and name of owner, has been obscured. Details of the contributor of each image can be found in the annotation to be included in the final release of the data, after completion of the challenge. Any queries about the use or ownership of the data should be addressed to the organizers.
⚠️ Warning The license for annotations is not clearly defined by the authors of the dataset.
Citation #
If you make use of the PASCAL VOC 2012 data, please cite the following reference:
@misc{pascal-voc-2012,
	author = "Everingham, M. and Van~Gool, L. and Williams, C. K. I. and Winn, J. and Zisserman, A.",
	title = "The {PASCAL} {V}isual {O}bject {C}lasses {C}hallenge 2012 {(VOC2012)} {R}esults",
	howpublished = "http://www.pascal-network.org/challenges/VOC/voc2012/workshop/index.html"
}
If you are happy with Dataset Ninja and use provided visualizations and tools in your work, please cite us:
@misc{ visualization-tools-for-pascal-voc-dataset,
  title = { Visualization Tools for PASCAL VOC 2012 Dataset },
  type = { Computer Vision Tools },
  author = { Dataset Ninja },
  howpublished = { \url{ https://datasetninja.com/pascal-voc-2012 } },
  url = { https://datasetninja.com/pascal-voc-2012 },
  journal = { Dataset Ninja },
  publisher = { Dataset Ninja },
  year = { 2026 },
  month = { feb },
  note = { visited on 2026-02-22 },
}
Download #
Dataset PASCAL VOC 2012 can be downloaded in Supervisely format:
As an alternative, it can be downloaded with dataset-tools package:
pip install --upgrade dataset-tools
… using following python code:
import dataset_tools as dtools

dtools.download(dataset='PASCAL VOC 2012', dst_dir='~/dataset-ninja/')
Make sure not to overlook the python code example available on the Supervisely Developer Portal. It will give you a clear idea of how to effortlessly work with the downloaded dataset.
The data in original format can be downloaded here:
Disclaimer #
Our gal from the legal dep told us we need to post this:
Dataset Ninja provides visualizations and statistics for some datasets that can be found online and can be downloaded by general audience. Dataset Ninja is not a dataset hosting platform and can only be used for informational purposes. The platform does not claim any rights for the original content, including images, videos, annotations and descriptions. Joint publishing is prohibited.
You take full responsibility when you use datasets presented at Dataset Ninja, as well as other information, including visualizations and statistics we provide. You are in charge of compliance with any dataset license and all other permissions. You are required to navigate datasets homepage and make sure that you can use it. In case of any questions, get in touch with us at hello@datasetninja.com.


