

Introduction #
The QHDF: QUT-HIA-DAF Field Dataset was collected in Australia under direct sunlight in a field situation. All cultivars in the dataset consist of three classes: green, mixed, and red. Agricultural robotics is a rapidly evolving research field due to advances in computer vision, machine learning, robotics, and increased agricultural demand. The authors explore the issue of generalisability by considering a fruit (sweet pepper) that is grown using different cultivar (subspecies) and in different environments (field vs glasshouse).
Note, similar QHDF: QUT-HIA-DAF Field Dataset datasets are also available on the DatasetNinja.com:
Motivation
The realm of agricultural robotics is swiftly advancing thanks to breakthroughs in computer vision, machine learning, and robotics, spurred on by the growing demands of agriculture. Yet, there remains a significant disparity between farming necessities and the technology currently available, largely due to the diverse nature of cropping environments. This underscores the urgent requirement for more universally applicable models.
The prominence of agricultural robotics continues to rise, driven by progress in robotics, computer vision, and machine learning. These advancements are propelled by the imperative for farmers to enhance both yield and quality while simultaneously reducing labor costs, a factor that has long been recognized as one of the most financially burdensome aspects of agriculture. Enhancing these key farming metrics necessitates automated technologies like weed management and harvesting. Within these domains, the integration of robotic vision and machine learning is poised to play a pivotal role in ensuring successful incorporation into existing agricultural processes.
Dataset description
The authors explore the issue of generalisability by considering a fruit (sweet pepper) that is grown using different cultivars (subspecies) and in different environments (field vs glasshouse). To investigate these differences, they publicly release three novel datasets captured with different domains, cultivars, cameras, and geographic locations. The authors exploit these new datasets in a singular and combined (to promote generalisation) manner to evaluate sweet pepper (fruit) detection and classification in the wild. The authors complete an analysis of sweet pepper detection in the wild, employing three datasets which they
release publicly. Each dataset used in this evaluation represents a different domain. They exploit datasets collected in two unique geographical locations: Australia and Germany; and in three different set ups: field, polytunnel, and a glass house. The two QHD sets were collected in Australia by the Queensland University of Technology (QUT) with Horticulture Innovation Australia (HIA) and the Department of Agriculture and Fisheries (DAF). The final dataset (BUP) was collected in Germany by the University of Bonn.
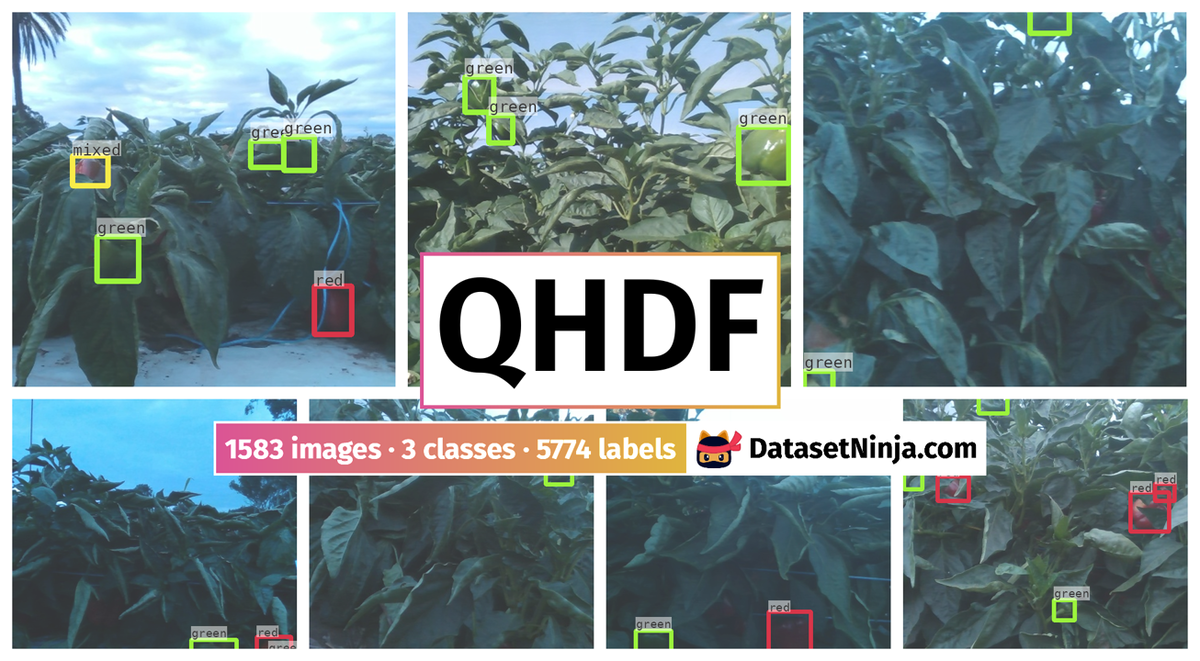
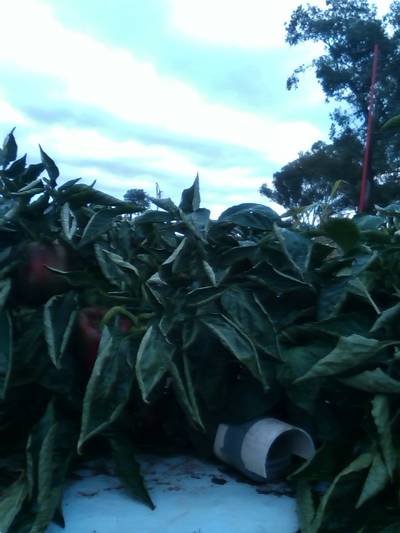
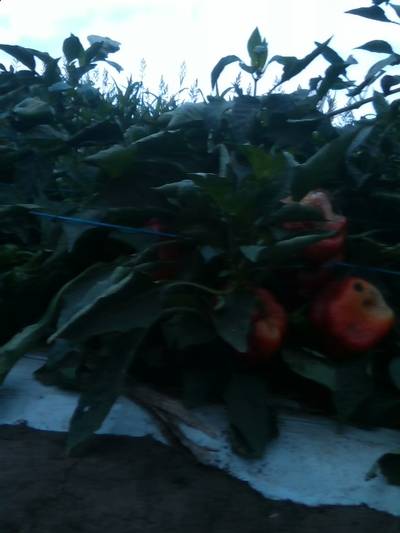
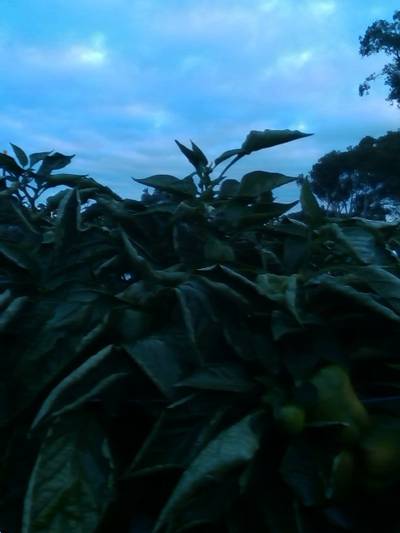
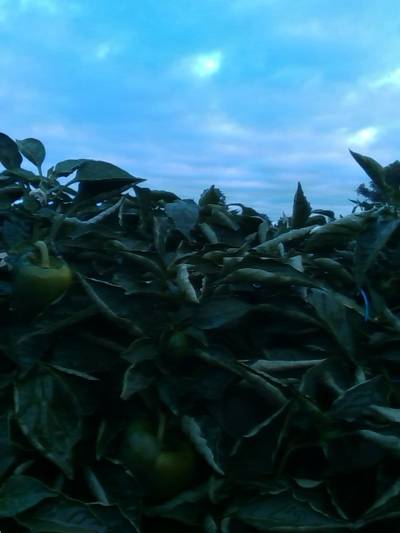
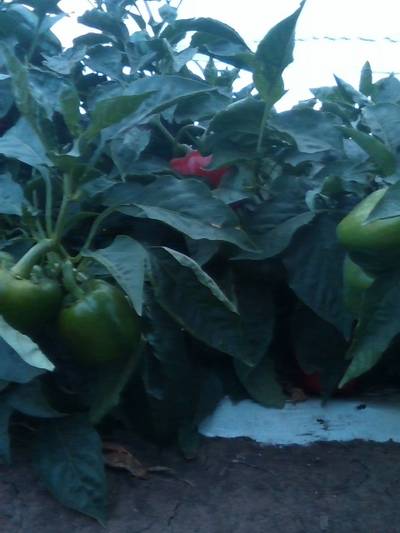
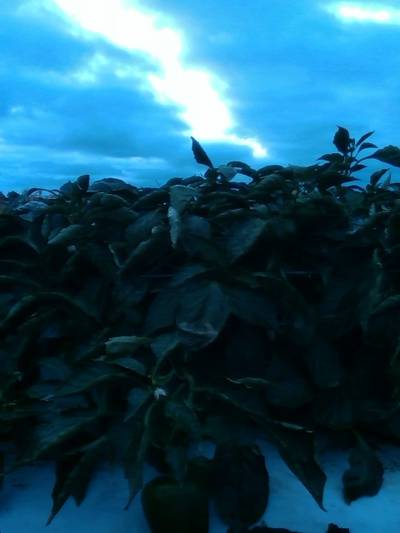
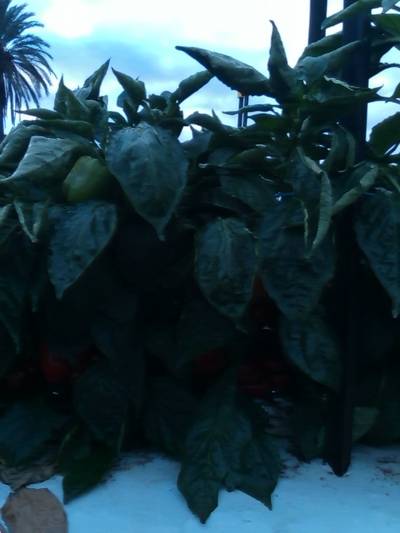
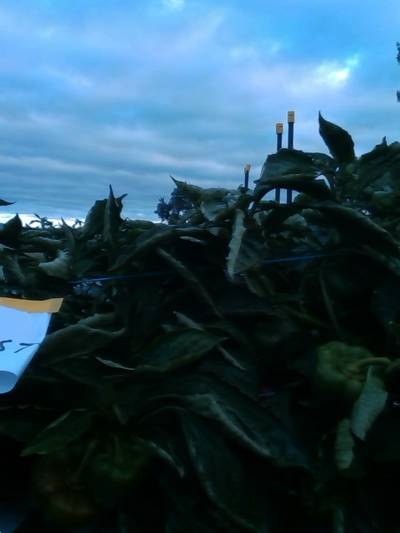
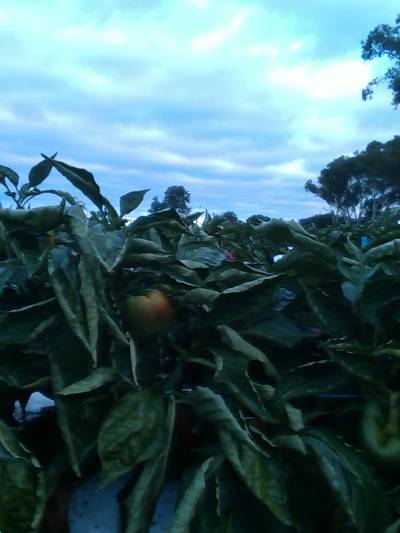
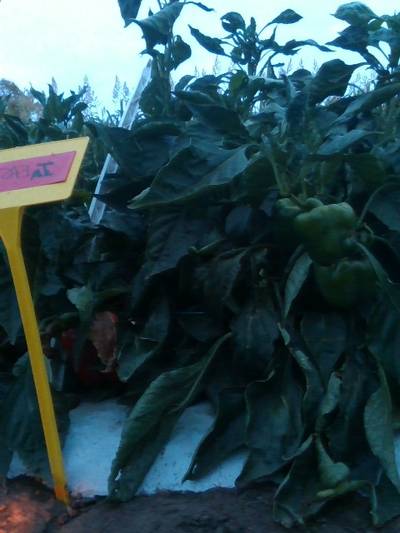
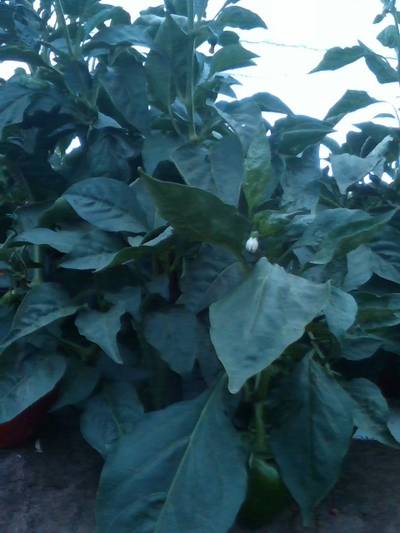
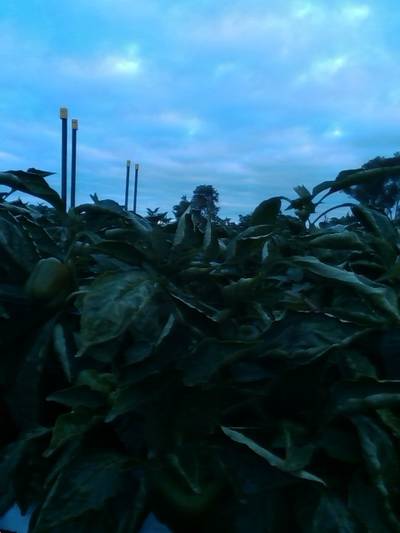
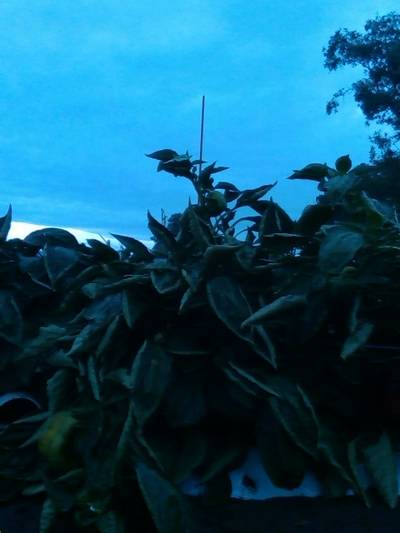
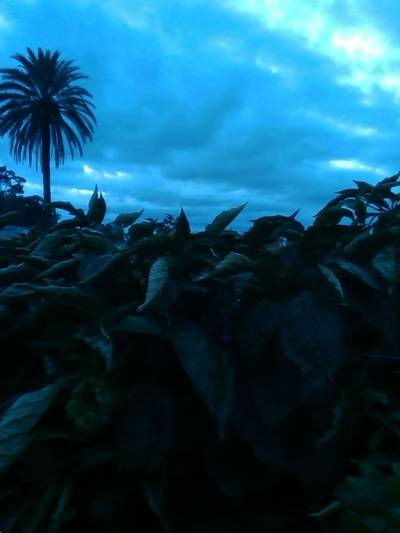
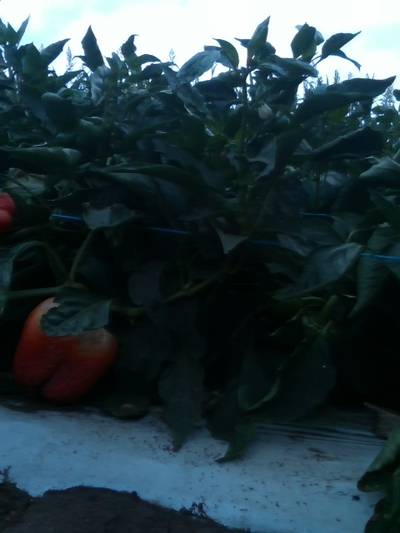
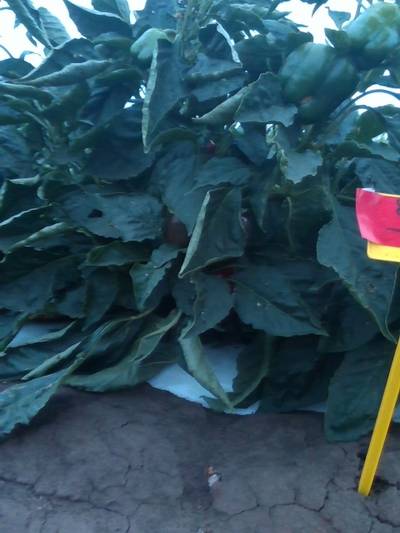
Example images from each of the three datasets: (left column) QHDF field dataset; (middle column) BUP glass house dataset; and (right column) QHDP protected extended dataset.
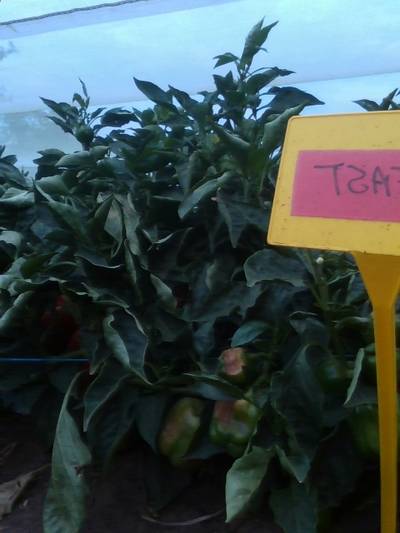
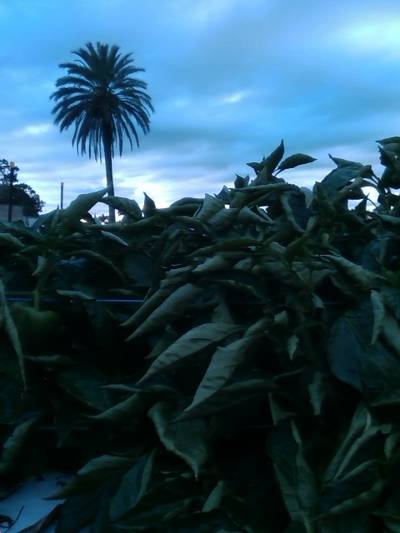
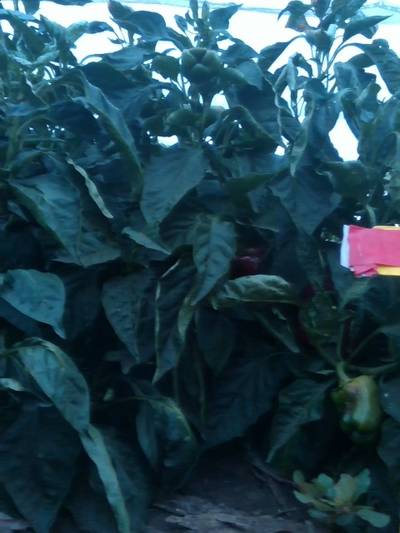
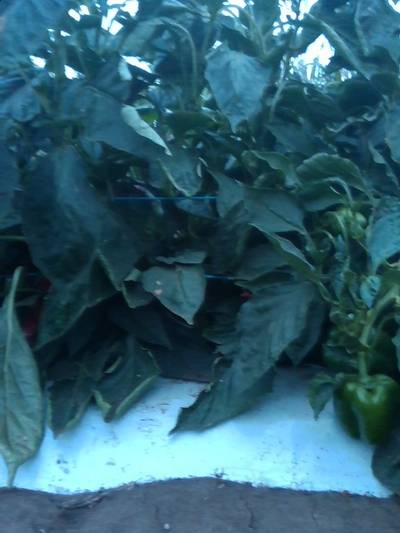
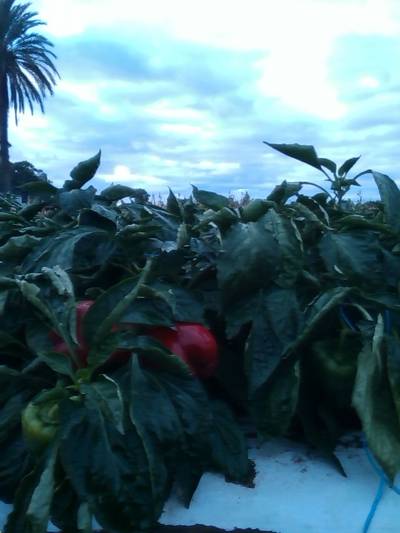
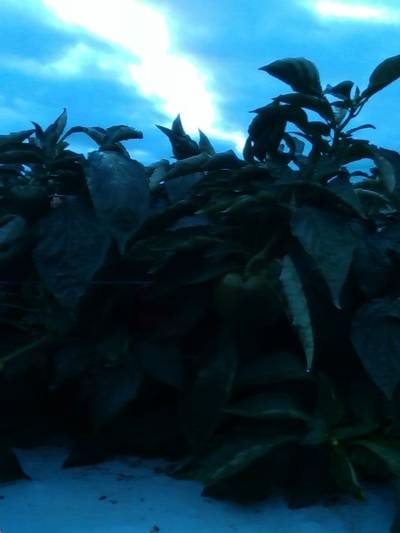
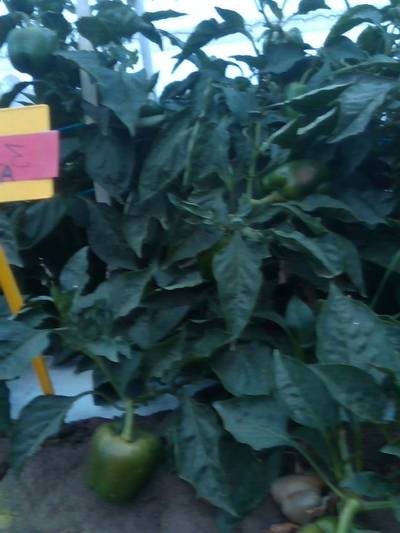
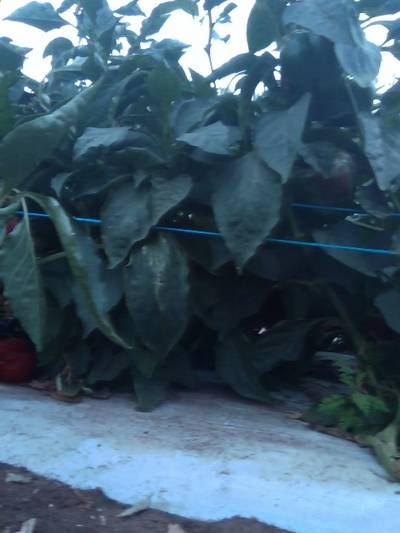
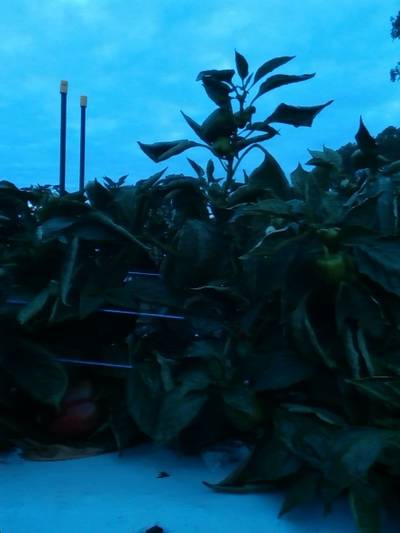
The QHDF dataset was collected under direct sunlight in a field situation. It consists of two cultivar, Warlock and SV6947, each cultivar was planted in a single- and double-row plant configuration in outdoor field conditions. Due to the direct exposure to the sun plants in this domain are smaller in stature and with greater amounts of foliage to protect the fruits. The singleand double-row configurations also provide the potential for varying levels of foliage and occlusion. Data was collected using a RealSense 200 camera at resolutions of 640 × 480. Annotation of the sweet pepper location and their sub-classes was carried out by a single person with checks for ambiguity.
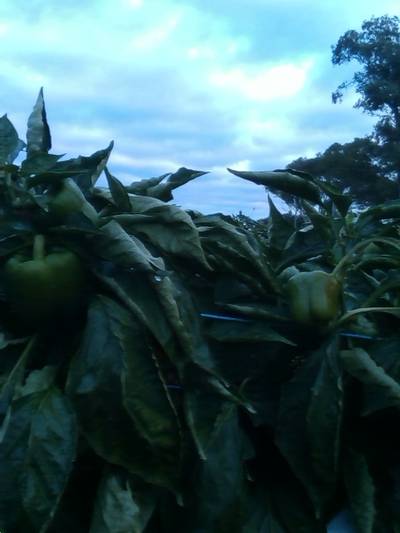
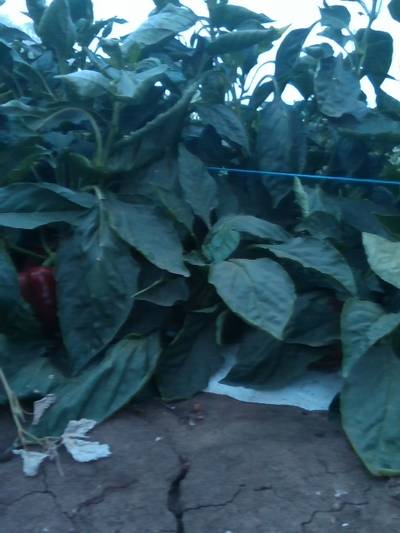
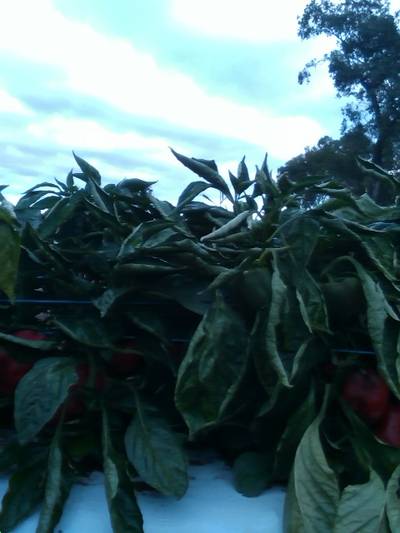
Four example images with their respective bounding boxes from the QHDF dataset.
| Dataset | T | V | E | Height | Width | Camera |
|---|---|---|---|---|---|---|
| QHDF | 509 | 604 | 470 | 640 | 480 | RealSense 200 |
| QHDP | 345 | 86 | 256 | 640 | 480 | RealSense 200 |
| BUP | 114 | 84 | 88 | 1280 | 720 | RealSense 435i |
The number of images contained in each of the datasets used in this paper, where ’T’, ’V’, and ’E’ represent the training, validation, and evaluation sets respectively.
| Dataset | Subset | Green | Mixed | Red |
|---|---|---|---|---|
| QHDF | training | 1215 | 89 | 609 |
| validation | 1389 | 94 | 716 | |
| evaluation | 1131 | 73 | 458 | |
| QHDP | training | 782 | 170 | 718 |
| validation | 208 | 34 | 155 | |
| evaluation | 956 | 190 | 528 |
Distribution of sweet pepper in each of the QHD datasets.
 Homepage
 Research Paper
Summary #
QHDF: QUT-HIA-DAF Field Dataset is a dataset for an object detection task. It is used in the agricultural and robotics industries.
The dataset consists of 1583 images with 5774 labeled objects belonging to 3 different classes including green, red, and mixed.
Images in the QHDF dataset have bounding box annotations. There are 3 (0% of the total) unlabeled images (i.e. without annotations). There are 3 splits in the dataset: val (604 images), train (509 images), and eval (470 images). The dataset was released in 2020 by the University of Bonn, Germany and Queensland University of Technology, Australia.
Explore #
QHDF dataset has 1583 images. Click on one of the examples below or open "Explore" tool anytime you need to view dataset images with annotations. This tool has extended visualization capabilities like zoom, translation, objects table, custom filters and more. Hover the mouse over the images to hide or show annotations.


Class balance #
There are 3 annotation classes in the dataset. Find the general statistics and balances for every class in the table below. Click any row to preview images that have labels of the selected class. Sort by column to find the most rare or prevalent classes.

Class ㅤ | Images ㅤ | Objects ㅤ | Count on image average | Area on image average |
|---|---|---|---|---|
green➔ rectangle | 1361 | 3735 | 2.74 | 4.23% |
red➔ rectangle | 920 | 1783 | 1.94 | 2.77% |
mixed➔ rectangle | 226 | 256 | 1.13 | 2.37% |
Co-occurrence matrix #
Co-occurrence matrix is an extremely valuable tool that shows you the images for every pair of classes: how many images have objects of both classes at the same time. If you click any cell, you will see those images. We added the tooltip with an explanation for every cell for your convenience, just hover the mouse over a cell to preview the description.
Images #
Explore every single image in the dataset with respect to the number of annotations of each class it has. Click a row to preview selected image. Sort by any column to find anomalies and edge cases. Use horizontal scroll if the table has many columns for a large number of classes in the dataset.
Object distribution #
Interactive heatmap chart for every class with object distribution shows how many images are in the dataset with a certain number of objects of a specific class. Users can click cell and see the list of all corresponding images.
Class sizes #
The table below gives various size properties of objects for every class. Click a row to see the image with annotations of the selected class. Sort columns to find classes with the smallest or largest objects or understand the size differences between classes.
Class | Object count | Avg area | Max area | Min area | Min height | Min height | Max height | Max height | Avg height | Avg height | Min width | Min width | Max width | Max width |
|---|---|---|---|---|---|---|---|---|---|---|---|---|---|---|
green rectangle | 3735 | 1.56% | 20% | 0.09% | 17px | 2.66% | 279px | 43.59% | 67px | 10.47% | 15px | 3.12% | 240px | 50% |
red rectangle | 1783 | 1.44% | 7.86% | 0.12% | 16px | 2.5% | 168px | 26.25% | 64px | 9.95% | 15px | 3.12% | 210px | 43.75% |
mixed rectangle | 256 | 2.09% | 12.19% | 0.13% | 18px | 2.81% | 196px | 30.62% | 78px | 12.22% | 17px | 3.54% | 191px | 39.79% |
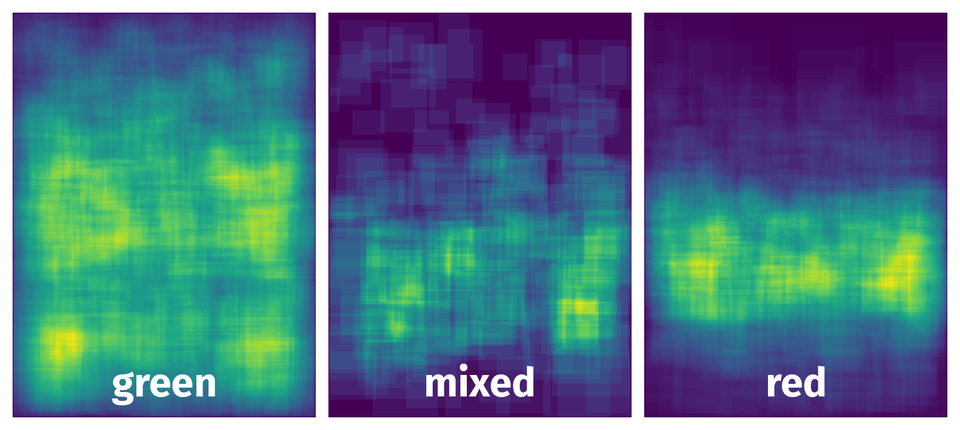
Spatial Heatmap #
The heatmaps below give the spatial distributions of all objects for every class. These visualizations provide insights into the most probable and rare object locations on the image. It helps analyze objects' placements in a dataset.
Objects #
Table contains all 5774 objects. Click a row to preview an image with annotations, and use search or pagination to navigate. Sort columns to find outliers in the dataset.
Object ID ㅤ | Class ㅤ | Image name click row to open | Image size height x width | Height ㅤ | Height ㅤ | Width ㅤ | Width ㅤ | Area ㅤ |
|---|---|---|---|---|---|---|---|---|
1➔ | red rectangle | 2017_06_12_row4_2017-06-12-07-09-55.bag_TOKEEP_img_000593.png | 640 x 480 | 63px | 9.84% | 61px | 12.71% | 1.25% |
2➔ | green rectangle | 2017_06_12_row4_2017-06-12-07-09-55.bag_TOKEEP_img_000593.png | 640 x 480 | 57px | 8.91% | 51px | 10.62% | 0.95% |
3➔ | mixed rectangle | 2017_06_12_row4_2017-06-12-07-09-55.bag_TOKEEP_img_000593.png | 640 x 480 | 52px | 8.12% | 57px | 11.88% | 0.96% |
4➔ | green rectangle | 2017_06_12_row4_2017-06-12-07-09-55.bag_TOKEEP_img_000593.png | 640 x 480 | 45px | 7.03% | 30px | 6.25% | 0.44% |
5➔ | green rectangle | 2017_06_12_row2_2017-06-12-07-20-39.bag_TOKEEP_img_000835.png | 640 x 480 | 31px | 4.84% | 32px | 6.67% | 0.32% |
6➔ | green rectangle | 2017_06_12_row2_2017-06-12-07-20-39.bag_TOKEEP_img_000835.png | 640 x 480 | 48px | 7.5% | 40px | 8.33% | 0.62% |
7➔ | green rectangle | 2017_06_12_row2_2017-06-12-07-20-39.bag_TOKEEP_img_000835.png | 640 x 480 | 45px | 7.03% | 50px | 10.42% | 0.73% |
8➔ | green rectangle | 2017_06_12_row2_2017-06-12-07-20-39.bag_TOKEEP_img_000835.png | 640 x 480 | 39px | 6.09% | 56px | 11.67% | 0.71% |
9➔ | red rectangle | 2017_06_12_row2_2017-06-12-07-20-39.bag_TOKEEP_img_000835.png | 640 x 480 | 23px | 3.59% | 29px | 6.04% | 0.22% |
10➔ | green rectangle | 2017_06_12_row2_2017-06-12-07-20-39.bag_TOKEEP_img_000835.png | 640 x 480 | 41px | 6.41% | 68px | 14.17% | 0.91% |
License #
Citation #
If you make use of the QHDF data, please cite the following reference:
@dataset{QHDF,
  author={Michael Halstead and Simon Denman and Clinton Fookes and Chris McCool},
  title={QUT-HIA-DAF Field Data},
  year={2020},
  url={https://data.researchdatafinder.qut.edu.au/dataset/qut-hia-daf-capsicum-datasets/resource/1fdca442-dca0-4fd0-8412-4231297336a9}
}
If you are happy with Dataset Ninja and use provided visualizations and tools in your work, please cite us:
@misc{ visualization-tools-for-qhdf-dataset,
  title = { Visualization Tools for QHDF Dataset },
  type = { Computer Vision Tools },
  author = { Dataset Ninja },
  howpublished = { \url{ https://datasetninja.com/qhdf } },
  url = { https://datasetninja.com/qhdf },
  journal = { Dataset Ninja },
  publisher = { Dataset Ninja },
  year = { 2026 },
  month = { jul },
  note = { visited on 2026-07-25 },
}
Download #
Dataset QHDF can be downloaded in Supervisely format:
As an alternative, it can be downloaded with dataset-tools package:
pip install --upgrade dataset-tools
… using following python code:
import dataset_tools as dtools

dtools.download(dataset='QHDF', dst_dir='~/dataset-ninja/')
Make sure not to overlook the python code example available on the Supervisely Developer Portal. It will give you a clear idea of how to effortlessly work with the downloaded dataset.
The data in original format can be downloaded here.
Disclaimer #
Our gal from the legal dep told us we need to post this:
Dataset Ninja provides visualizations and statistics for some datasets that can be found online and can be downloaded by general audience. Dataset Ninja is not a dataset hosting platform and can only be used for informational purposes. The platform does not claim any rights for the original content, including images, videos, annotations and descriptions. Joint publishing is prohibited.
You take full responsibility when you use datasets presented at Dataset Ninja, as well as other information, including visualizations and statistics we provide. You are in charge of compliance with any dataset license and all other permissions. You are required to navigate datasets homepage and make sure that you can use it. In case of any questions, get in touch with us at hello@datasetninja.com.