

Introduction #
The SYNTHIA-PANO: Panoramic Image Dataset is the panoramic version of SYNTHIA dataset. Panoramic images offer distinct advantages in terms of information capacity and scene stability, owing to their expansive field of view (FoV). To gauge the impact of incorporating panoramic images into the training dataset, the authors meticulously designed and executed a comprehensive set of experiments. The experimental findings underscore the advantageous influence of using panoramic images as training data on segmentation results. Notably, employing panoramic images with a 180-degree FoV in the training set enhances model performance. Furthermore, the model trained with panoramic images exhibits superior resilience against image distortion, showcasing an additional benefit of this approach.
Dataset creation
With the development of deep learning, the research on image analysis methods has been boosted. Semantic segmentation, different from the target detection technology, can extract information in the image at the pixel level. Currently, most semantic segmentation researches are based on images with a conventional field of view (FoV). The images with a conventional FoV that is relatively narrow can only cover information in a certain direction, and their content will change with respect to the viewpoint, so they have shortcomings in the aspect of information capacity and stability. In contrast, 360-degree panoramic images can compensate for these shortcomings. However, due to their large FoV and distortion, the general semantic segmentation method and training data are not ideal for the segmentation of panoramic images. The accuracy will decrease and the general input size of a model requires cutting the panoramic image into several segments,3 which will lead to discontinuity in the segmentation map. In order to realize the better segmentation of panoramic images, the authors created a dataset of panoramic images and apply it for the training of convolutional neural network to yield a panoramic semantic segmentation model.
The typical method to deal with the distortion in panoramic images is to use data augmentation. The data augmentation can simulate the distortion in panoramic images. When trained with such augmented data, the model can adapt well to panoramic images with distortion. However, the general public datasets for segmentation only contain images of forward-direction view, which can’t simulate the large FoV of panoramic images. The authors method is to synthesize a new dataset of panoramic images. Their panoramic dataset is built from the virtual image dataset SYNTHIA due to the lack of real-world panoramic image dataset. SYHTHIA dateset contains finely labeled images with a conventional FoV. The authors managed to stitch the images taken from different directions into panoramic images, together with their labeled images, to yield the panoramic semantic segmentation dataset dubbed SYNTHIA-PANO.
Panoramic images segmentation methods
A deep neural network can achieve good accuracy, sometimes it suffers from the complexity. Panoramic images are often large in size due to their large FoV, which may cause a high computational consumption if a deep neural network is used. However, for a model there is a tradeoff between the complexity and the performance. A complex model tends to have good performance but high consumption. The Image Cascade Network (ICNet) is designed for real-time semantic segmentation of high-resolution images and it balances the accuracy and time consumption well.
The authors choose to use ICNet as the basic model directly and focus our work on the training data. They made a new dataset which consists of panoramic images. The new dataset the authors made is based on another dataset called SYNTHIA. SYNTHIA dataset is created from computer 3D city traffic scene models and all of the images in it are virtual images. It contains some subsets called SYNTHIA-Seqs in which the images are taken by four cameras in leftward, forward, rightward and backward directions on a moving car in the virtual cities. In addition, there are images of different city scenes, seasons, weather conditions and so on. What the authors did is to stitch these four-direction images into panoramic images.
The figure is a demonstration of the the images and labels in SYNTHIA dataset. The color of each class is below.
One way to get panoramic images is to take images from different directions around a circle and then stitch them together. When the camera rotates, the geometrical relations between the objects in the images also changes. To unify the geometrical relations of the whole scene, cylindrical projection is an important step before stitching a panoramic image. If the scene is projected on a cylindrical surface, one object in the images from different view directions can be quite the same. In this sense, when stitching the images, the overlapping parts can coincide with each other perfectly.
The figure is a demonstration of the cylindrical projection. Every point (x, y) on the image have a corresponding point (x0, y0) on the surface of the cylinder. The corresponding point is on the line which passes the center point of the cylinder and the original point.
The mapping built above is just cylindrical projection and the result of it is an image on cylindrical surface. The most important parameter when doing it is the radius of the cylindrical surface r which is often set the same as the focal length f. Generally, a small focal length f leads to severe distortion and vice versa.
For four images in leftward, forward, rightward and backward directions denoted as, the authors can project the normal images into a cylindrical surface, and the next step is to stitch them together.
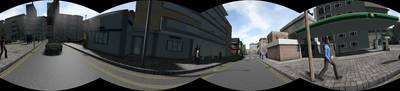
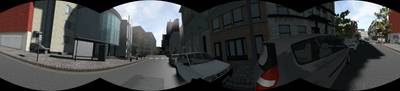
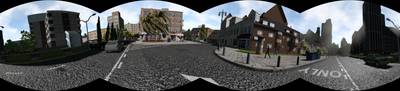
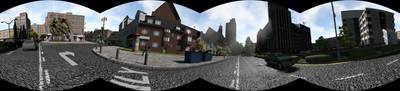
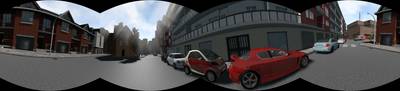
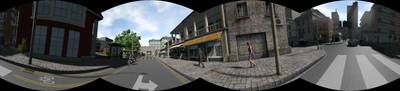
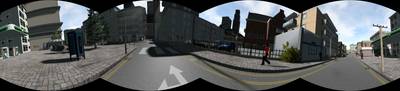
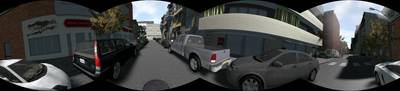
The four images and their labels in leftward, forward, rightward and backward directions are shown on the left of the figure. After the transforms, they are projected on a cylindrical surface and stitched together.
Dataset description
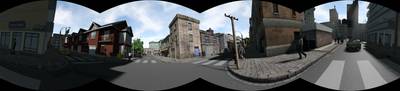
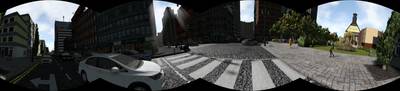
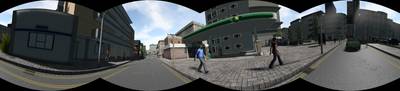
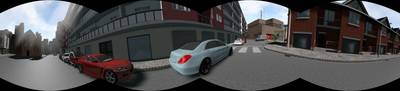
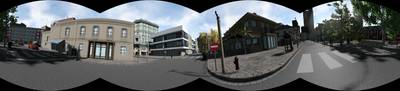
By means above, a panoramic image dataset can be obtained from the original SYNTHIA dataset. The authors panoramic image dataset includes five sequences of images: seqs02-summer, seqs02-fall, seqs04-summer, seqs04-fall, seqs05-summer. Seqs02 series and Seqs05 series are taken in a New York like city and Seqs04 series are taken in a European town like city. The original images are ordered video sequences and we truncated the repeated images.
 Homepage
 Research Paper
Summary #
SYNTHIA-PANO Panoramic Image Dataset is a dataset for semantic segmentation and object detection tasks. It is used in the automotive industry.
The dataset consists of 3236 images with 43308 labeled objects belonging to 14 different classes including void, sky, building, and other: road, vegetation, pole, car, traffic sign, landmarking, sidewalk, pedestrian, traffic light, fence, and bicycle.
Images in the SYNTHIA-PANO dataset have pixel-level semantic segmentation annotations. All images are labeled (i.e. with annotations). There are no pre-defined train/val/test splits in the dataset. Alternatively, the dataset could be split into 5 sequences: seqs05_summer (787 images), seqs04_fall (738 images), seqs04_summer (694 images), seqs02_summer (556 images), and seqs02_fall (461 images). The dataset was released in 2019 by the College of Optical Science and Engineering, Zhejiang University, China.
Explore #
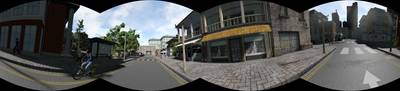
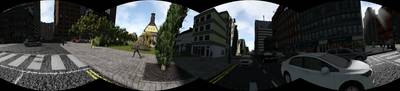
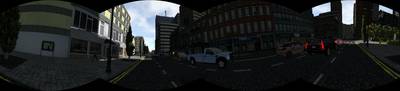
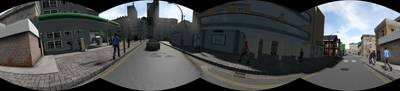
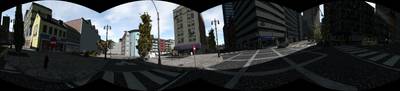
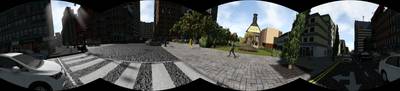
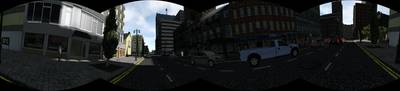
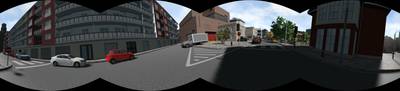
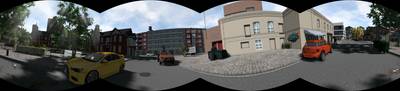
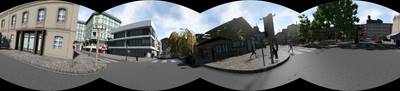
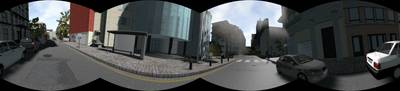
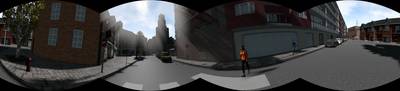
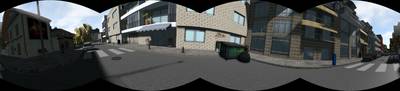
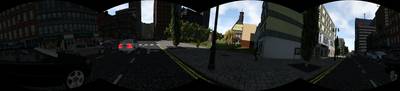
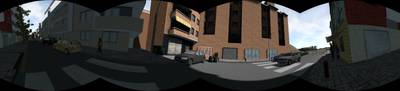
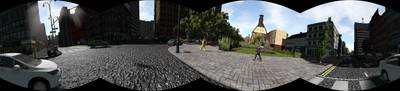
SYNTHIA-PANO dataset has 3236 images. Click on one of the examples below or open "Explore" tool anytime you need to view dataset images with annotations. This tool has extended visualization capabilities like zoom, translation, objects table, custom filters and more. Hover the mouse over the images to hide or show annotations.


Class balance #
There are 14 annotation classes in the dataset. Find the general statistics and balances for every class in the table below. Click any row to preview images that have labels of the selected class. Sort by column to find the most rare or prevalent classes.

Class ㅤ | Images ㅤ | Objects ㅤ | Count on image average | Area on image average |
|---|---|---|---|---|
void➔ mask | 3236 | 3236 | 1 | 11.62% |
vegetation➔ mask | 3236 | 3236 | 1 | 5.07% |
traffic sign➔ mask | 3236 | 3236 | 1 | 0.16% |
sky➔ mask | 3236 | 3236 | 1 | 10.24% |
road➔ mask | 3236 | 3236 | 1 | 23.9% |
pole➔ mask | 3236 | 3236 | 1 | 1.07% |
landmarking➔ mask | 3236 | 3236 | 1 | 2.83% |
car➔ mask | 3236 | 3236 | 1 | 3.79% |
building➔ mask | 3236 | 3236 | 1 | 32.12% |
sidewalk➔ mask | 3226 | 3226 | 1 | 7.62% |
Co-occurrence matrix #
Co-occurrence matrix is an extremely valuable tool that shows you the images for every pair of classes: how many images have objects of both classes at the same time. If you click any cell, you will see those images. We added the tooltip with an explanation for every cell for your convenience, just hover the mouse over a cell to preview the description.
Images #
Explore every single image in the dataset with respect to the number of annotations of each class it has. Click a row to preview selected image. Sort by any column to find anomalies and edge cases. Use horizontal scroll if the table has many columns for a large number of classes in the dataset.
Object distribution #
Interactive heatmap chart for every class with object distribution shows how many images are in the dataset with a certain number of objects of a specific class. Users can click cell and see the list of all corresponding images.
Class sizes #
The table below gives various size properties of objects for every class. Click a row to see the image with annotations of the selected class. Sort columns to find classes with the smallest or largest objects or understand the size differences between classes.
Class | Object count | Avg area | Max area | Min area | Min height | Min height | Max height | Max height | Avg height | Avg height | Min width | Min width | Max width | Max width |
|---|---|---|---|---|---|---|---|---|---|---|---|---|---|---|
void mask | 3236 | 11.62% | 31.4% | 10.08% | 760px | 100% | 760px | 100% | 760px | 100% | 3340px | 100% | 3340px | 100% |
vegetation mask | 3236 | 5.07% | 34.58% | 0.1% | 81px | 10.66% | 748px | 98.42% | 403px | 53.02% | 100px | 2.99% | 3340px | 100% |
traffic sign mask | 3236 | 0.16% | 0.96% | 0% | 7px | 0.92% | 524px | 68.95% | 214px | 28.13% | 85px | 2.54% | 3340px | 100% |
sky mask | 3236 | 10.24% | 32.17% | 2.53% | 245px | 32.24% | 748px | 98.42% | 412px | 54.2% | 1319px | 39.49% | 3340px | 100% |
road mask | 3236 | 23.9% | 38.36% | 11.57% | 376px | 49.47% | 485px | 63.82% | 436px | 57.34% | 2145px | 64.22% | 3340px | 100% |
pole mask | 3236 | 1.07% | 2.98% | 0.16% | 236px | 31.05% | 760px | 100% | 517px | 67.99% | 1385px | 41.47% | 3340px | 100% |
landmarking mask | 3236 | 2.83% | 10.25% | 0.02% | 113px | 14.87% | 511px | 67.24% | 381px | 50.16% | 1300px | 38.92% | 3340px | 100% |
car mask | 3236 | 3.79% | 28.93% | 0.02% | 57px | 7.5% | 584px | 76.84% | 265px | 34.89% | 189px | 5.66% | 3340px | 100% |
building mask | 3236 | 32.12% | 51.82% | 4.01% | 407px | 53.55% | 597px | 78.55% | 486px | 63.89% | 1810px | 54.19% | 3340px | 100% |
sidewalk mask | 3226 | 7.62% | 19.98% | 0% | 1px | 0.13% | 467px | 61.45% | 314px | 41.38% | 1px | 0.03% | 3340px | 100% |
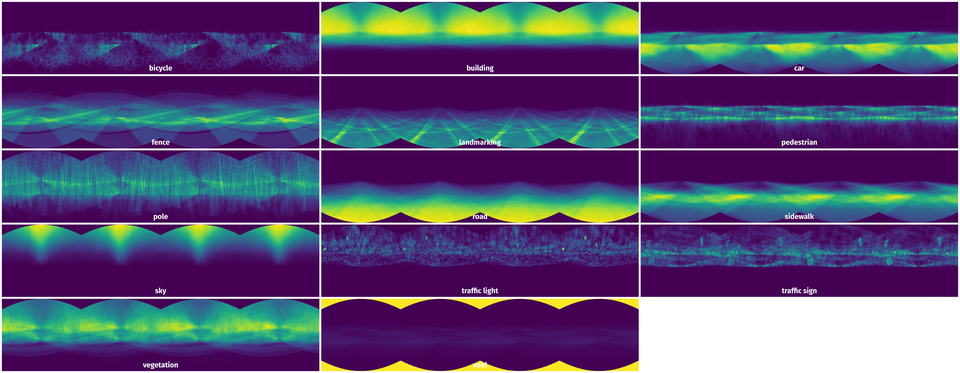
Spatial Heatmap #
The heatmaps below give the spatial distributions of all objects for every class. These visualizations provide insights into the most probable and rare object locations on the image. It helps analyze objects' placements in a dataset.
Objects #
Table contains all 43308 objects. Click a row to preview an image with annotations, and use search or pagination to navigate. Sort columns to find outliers in the dataset.
Object ID ㅤ | Class ㅤ | Image name click row to open | Image size height x width | Height ㅤ | Height ㅤ | Width ㅤ | Width ㅤ | Area ㅤ |
|---|---|---|---|---|---|---|---|---|
1➔ | void mask | seqs02_fall_pano_648.png | 760 x 3340 | 760px | 100% | 3340px | 100% | 11.07% |
2➔ | sky mask | seqs02_fall_pano_648.png | 760 x 3340 | 464px | 61.05% | 3340px | 100% | 11.46% |
3➔ | building mask | seqs02_fall_pano_648.png | 760 x 3340 | 484px | 63.68% | 3319px | 99.37% | 31.4% |
4➔ | road mask | seqs02_fall_pano_648.png | 760 x 3340 | 440px | 57.89% | 3340px | 100% | 26.17% |
5➔ | sidewalk mask | seqs02_fall_pano_648.png | 760 x 3340 | 245px | 32.24% | 3340px | 100% | 5.1% |
6➔ | fence mask | seqs02_fall_pano_648.png | 760 x 3340 | 79px | 10.39% | 802px | 24.01% | 0.04% |
7➔ | vegetation mask | seqs02_fall_pano_648.png | 760 x 3340 | 453px | 59.61% | 3340px | 100% | 3.68% |
8➔ | pole mask | seqs02_fall_pano_648.png | 760 x 3340 | 534px | 70.26% | 2805px | 83.98% | 1.5% |
9➔ | car mask | seqs02_fall_pano_648.png | 760 x 3340 | 302px | 39.74% | 2099px | 62.84% | 1.64% |
10➔ | traffic sign mask | seqs02_fall_pano_648.png | 760 x 3340 | 312px | 41.05% | 2794px | 83.65% | 0.27% |
License #
Citation #
If you make use of the SYNTHIA-PANO data, please cite the following reference:
@dataset{SYNTHIA-PANO,
  author={Yuanyou Xu and Kaiwei Wang and Kailun Yang and Dongming Sun and Jia Fu},
  title={SYNTHIA-PANO Panoramic Image Dataset},
  year={2019},
  url={https://github.com/Francis515/SYNTHIA-PANO}
}
If you are happy with Dataset Ninja and use provided visualizations and tools in your work, please cite us:
@misc{ visualization-tools-for-synthia-pano-dataset,
  title = { Visualization Tools for SYNTHIA-PANO Dataset },
  type = { Computer Vision Tools },
  author = { Dataset Ninja },
  howpublished = { \url{ https://datasetninja.com/synthia-pano } },
  url = { https://datasetninja.com/synthia-pano },
  journal = { Dataset Ninja },
  publisher = { Dataset Ninja },
  year = { 2026 },
  month = { jul },
  note = { visited on 2026-07-22 },
}
Download #
Dataset SYNTHIA-PANO can be downloaded in Supervisely format:
As an alternative, it can be downloaded with dataset-tools package:
pip install --upgrade dataset-tools
… using following python code:
import dataset_tools as dtools

dtools.download(dataset='SYNTHIA-PANO', dst_dir='~/dataset-ninja/')
Make sure not to overlook the python code example available on the Supervisely Developer Portal. It will give you a clear idea of how to effortlessly work with the downloaded dataset.
The data in original format can be downloaded here.
Disclaimer #
Our gal from the legal dep told us we need to post this:
Dataset Ninja provides visualizations and statistics for some datasets that can be found online and can be downloaded by general audience. Dataset Ninja is not a dataset hosting platform and can only be used for informational purposes. The platform does not claim any rights for the original content, including images, videos, annotations and descriptions. Joint publishing is prohibited.
You take full responsibility when you use datasets presented at Dataset Ninja, as well as other information, including visualizations and statistics we provide. You are in charge of compliance with any dataset license and all other permissions. You are required to navigate datasets homepage and make sure that you can use it. In case of any questions, get in touch with us at hello@datasetninja.com.