

Introduction #
The authors of the ISIC Challenge 2018: International Skin Imaging Collaboration Challenge 2018 dataset emphasize that skin cancer, being the most prevalent form of cancer, poses challenges in early detection due to visual similarities with benign lesions. The challenge discussed in their workshop represents the latest iteration of the largest automated skin cancer recognition challenge within the community. Hosted by the International Skin Imaging Collaboration (ISIC), the challenge was aimed to advance methods for segmentation, clinical attribute detection, and disease classification in dermoscopic images. In collaboration with the machine learning challenge, the authors planned to execute a significant reader study focused on disease diagnosis.
ISIC Challenge 2018 Overview
In their work the authors summarized the results of the largest skin image analysis challenge in the world, hosted by the International Skin Imaging Collaboration (ISIC), a global partnership that has organized the world’s largest public repository of dermoscopic images of skin. The dataset include over 12,500 images across 3 tasks. The key changed to evaluation criteria and study design were implemented to better reflect the complexity of clinical scenarios encountered in practice. These changes included:
Part 1: Lesion Segmentation A new segmentation metric to better account for extreme deviations from interobserver variability.
Part 2: Attribute Detection Implementation of balanced accuracy for classification decisions to minimize influence of prevalence and prior distributions that may not be consistent in practice.
Part 3: Disease Classification Inclusion of external test data from institutions excluded from representation in the training dataset, to better assess how algorithms generalize beyond the environments for which they were trained.
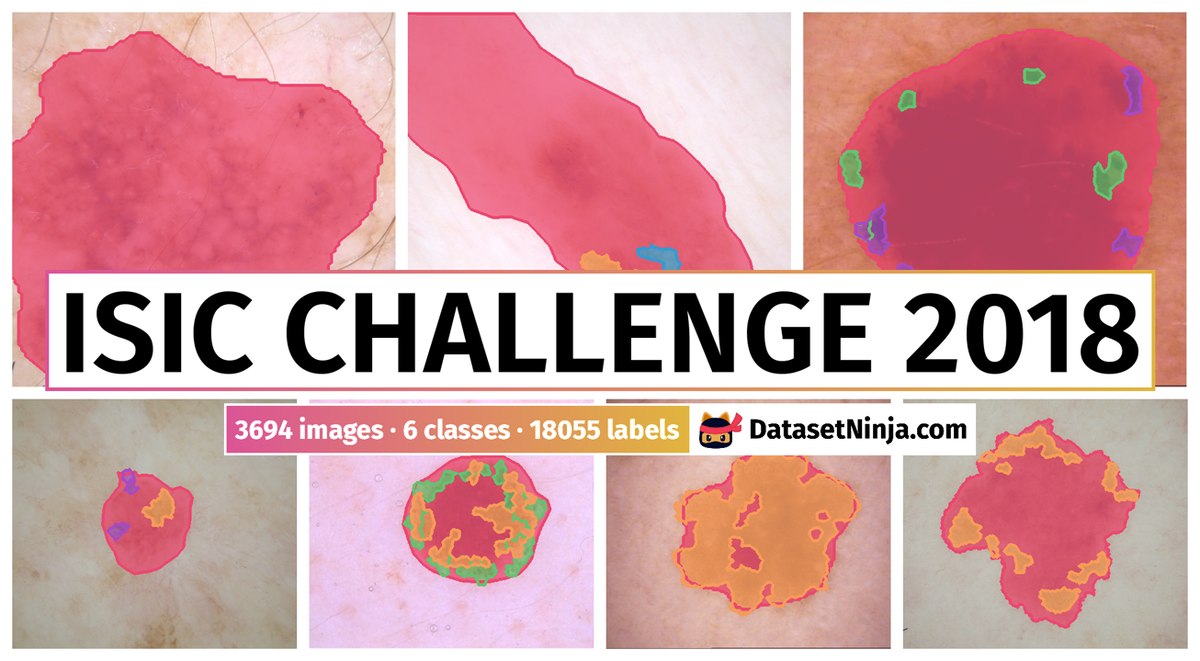
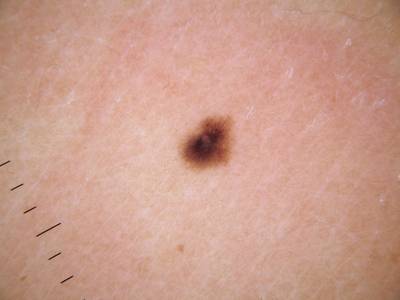
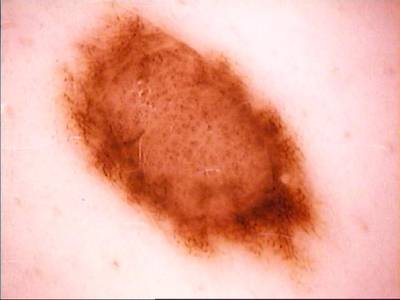
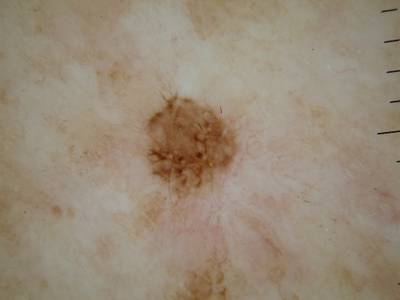
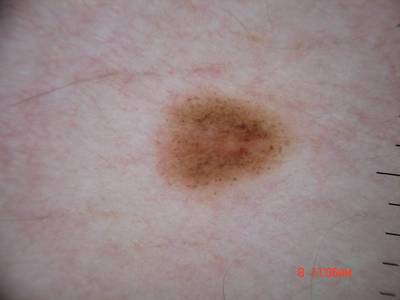
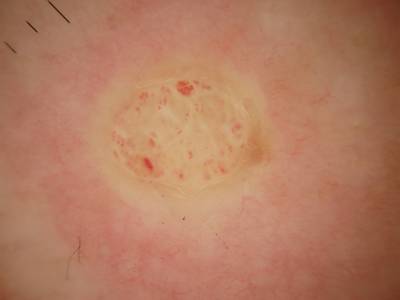
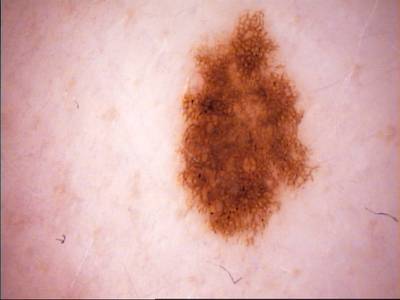
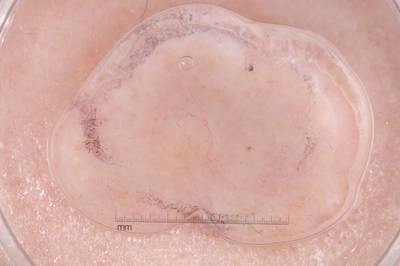
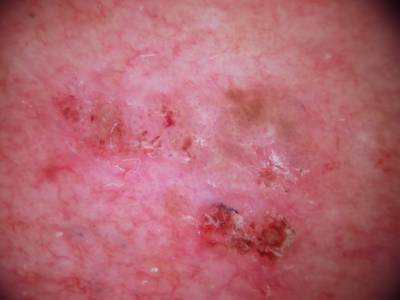
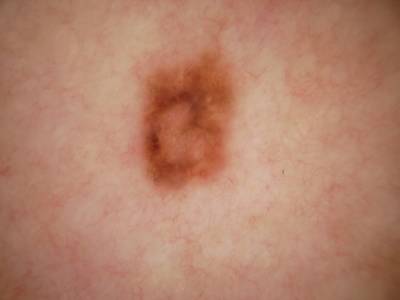
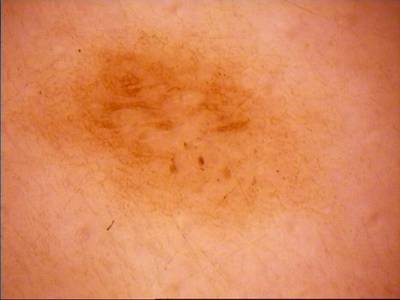
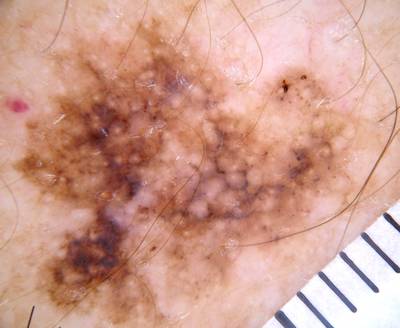
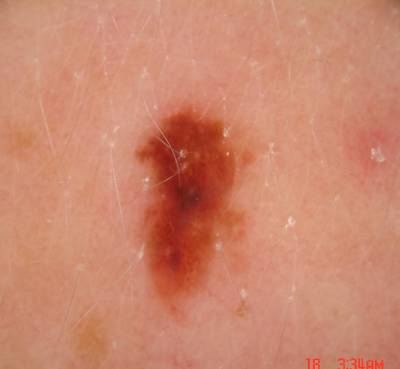
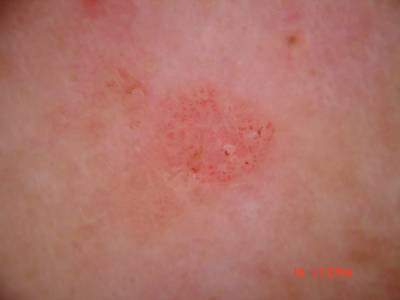
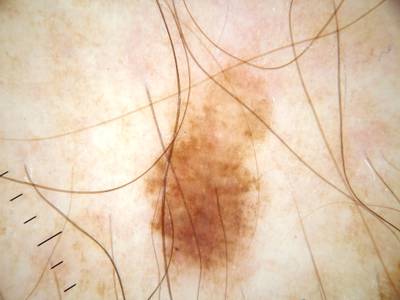
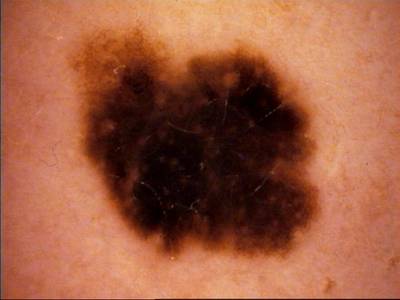
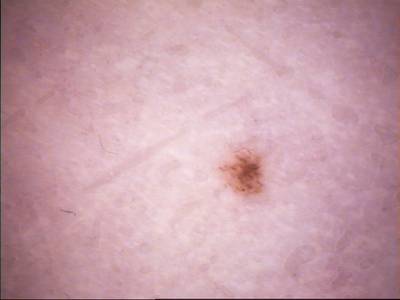
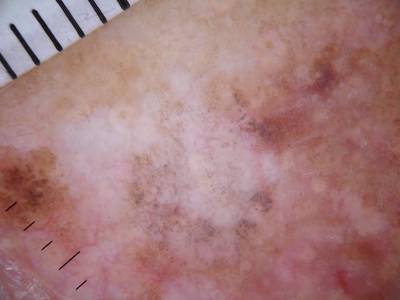
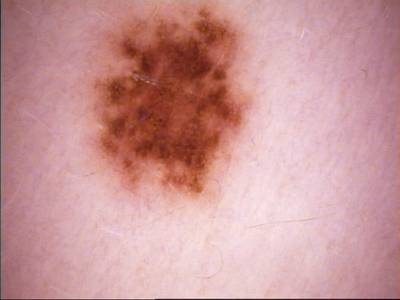
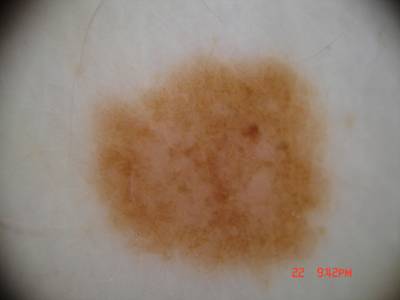
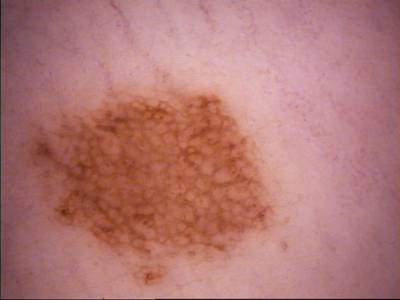
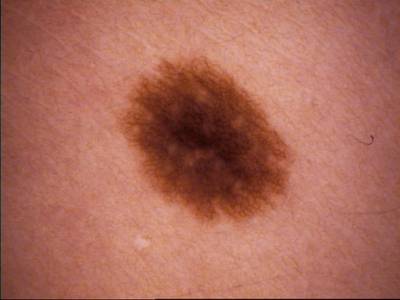
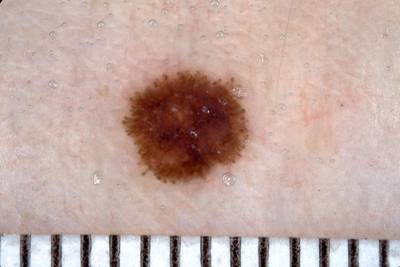
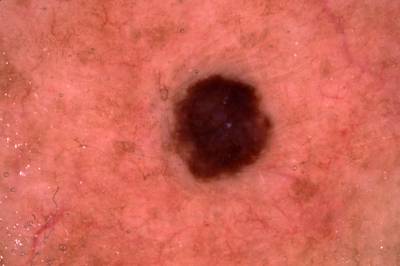
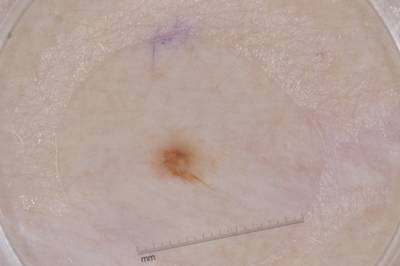
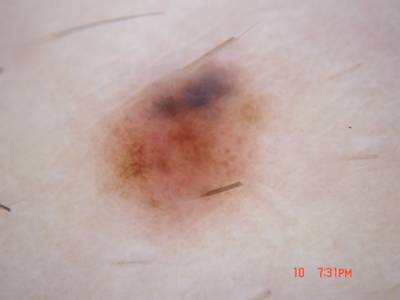
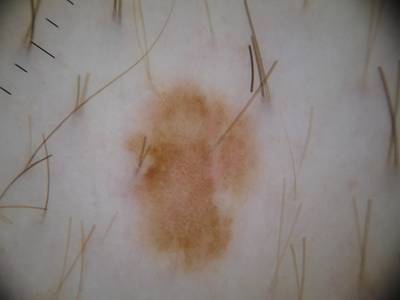
Example training data and ground truth from Part 1: Lesion Segmentation, Part 2: Attribution Detection, and Part 3: Disease Classification.
Note, similar ISIC Challenge 2018 datasets are also available on the DatasetNinja.com:
- Skin Cancer: HAM10000
- ISIC Challenge 2017: Part 1 - Lesion Segmentation
- ISIC Challenge 2017: Part 3 - Disease Classification Task
Lesion Segmentation
For lesion segmentation, 2,594 dermoscopic images with ground truth segmentation masks were provided for training. For validation and test sets, 100 and 1,000 images were provided, respectively, without ground truth masks. Evaluation criteria historically has been the Jaccard index, averaged over all images in the dataset. In practice, ground truth segmentation masks are influenced by inter-observer and intra-observer variability, due to variations in human annotators and variations in annotation software. An ideal evaluation would generate several ground truth segmentation masks for every image using multiple annotators and software systems. Then, for each image, predicted masks would be compared to the multiple ground truth masks to determine whether the predicted mask falls outside or within observer variability. However, this would multiply the manual labor required to generate ground truth masks, rendering such an evaluation impractical and infeasible. As an approximation to this ideal evaluation criteria, the authors introduced Thresholded Jaccard, which works similarly to standard Jaccard, with one important exception: if the Jaccard value of a particular mask falls below a threshold T, the Jaccard is set to zero. The value of the threshold T defines the point in which a segmentation is considered “incorrect”.
Lesion Attribute Detection
For attribute detection 2,594 images with 12,970 ground truth segmentation masks for 5 attributes were provided for training. For validation and held-out test sets, 100 and 1,000 images were provided, respectively, without masks. Jaccard was used as the evaluation metric in order to facilitate possible re-use of methods developed for segmentation, and encourage greater participation. As some dermoscopic attributes may be entirely absent from certain images, the Jaccard value for such attributes is ill-defined (division by 0). To overcome this difficulty, the Jaccard was measured by computing the TP, FP, and FN for the entire dataset, rather than a single image at a time.
Lesion Disease Classification
For disease classification 10,015 dermoscopic images with 7 ground truth classification labels were provided for training: actinic keratoses, basal cell carcinoma, benign keratosis-like lesions, dermatofibroma, melanoma, melanocytic nevi, vascular lesions tags. For validation and held-out test sets, 193 and 1,512 images were provided, respectively, without ground truth. Held-out test data was further split into two partitions:
- An “internal” partition, consisting of 1,196 images selected from data sources that were consistent with the training dataset (two institutions in Austria and Australia)
- An “external” partition, consisting of 316 images additionally selected from data sources not reflected in the training dataset (institutions from Turkey, New
Zealand, Sweden, and Argentina).
Evaluation was carried out using balanced accuracy (mean recall across classes after mutually exclusive classification decision), because dataset prevalence may not be reflective of real world disease prevalence, especially with regard to overrepresentation of melanomas.
The authors were provided some supplemental information, which you may find helpful when splitting the disease classification training data for users own internal training / evaluation processes. For each image in the disease classification training set , there is a lesion identifier (the lesion id tag) and a diagnosis confirm type methodology. Images with the same lesion id value show the same primary lesion on a patient, though the images may be taken at different camera positions, lighting conditions, and points in time. Images with a more rigorous diagnosis confirm type methodology are typically more difficult cases for human expert clinicians to evaluate, particularly when the images ultimate diagnosis is benign. In ascending order of rigorousness as applied to cases of the present dataset, the diagnosis confirm type methodologies are single image expert consensus, serial imaging showing no change, confocal microscopy with consensus dermoscopy, histopathology.
 Homepage
 HAM10000 Dataset PaperMSK Dataset Paper
Summary #
ISIC Challenge 2018: International Skin Imaging Collaboration Challenge 2018 is a dataset for instance segmentation, semantic segmentation, and object detection tasks. It is used in the medical research.
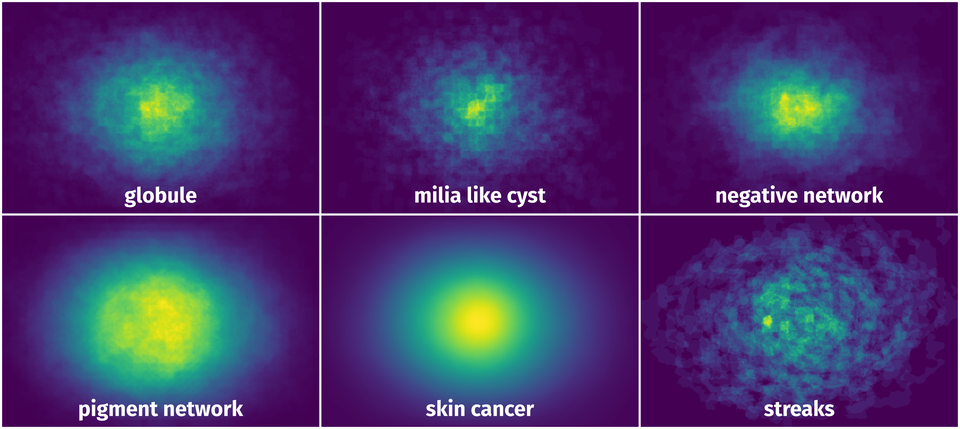
The dataset consists of 15414 images with 18055 labeled objects belonging to 6 different classes including skin cancer, pigment network, globule, and other: milia like cyst, negative network, and streaks.
Images in the ISIC Challenge 2018 dataset have pixel-level instance segmentation annotations. Due to the nature of the instance segmentation task, it can be automatically transformed into a semantic segmentation (only one mask for every class) or object detection (bounding boxes for every object) tasks. There are 11720 (76% of the total) unlabeled images (i.e. without annotations). There are 3 splits in the dataset: train (12609 images), test (2512 images), and val (293 images). Alternatively, the dataset could be split into 3 tasks: task 3: disease classification (11720 images), task 1: lesion segmentation (3694 images), and task 2: attribution detection (3694 images). Labels with lesion segmentation and attribute detection tasks are marked with the task (1 or 2 respectively). The dataset was released in 2018 by the US-AT joint research group.
Explore #
ISIC Challenge 2018 dataset has 15414 images. Click on one of the examples below or open "Explore" tool anytime you need to view dataset images with annotations. This tool has extended visualization capabilities like zoom, translation, objects table, custom filters and more. Hover the mouse over the images to hide or show annotations.


Class balance #
There are 6 annotation classes in the dataset. Find the general statistics and balances for every class in the table below. Click any row to preview images that have labels of the selected class. Sort by column to find the most rare or prevalent classes.

Class ㅤ | Images ㅤ | Objects ㅤ | Count on image average | Area on image average |
|---|---|---|---|---|
skin cancer➔ mask | 3694 | 3694 | 1 | 23.33% |
pigment network➔ mask | 2244 | 6122 | 2.73 | 7% |
globule➔ mask | 828 | 3784 | 4.57 | 2.71% |
milia like cyst➔ mask | 773 | 3328 | 4.31 | 0.86% |
negative network➔ mask | 275 | 542 | 1.97 | 3.44% |
streaks➔ mask | 183 | 585 | 3.2 | 1.52% |
Co-occurrence matrix #
Co-occurrence matrix is an extremely valuable tool that shows you the images for every pair of classes: how many images have objects of both classes at the same time. If you click any cell, you will see those images. We added the tooltip with an explanation for every cell for your convenience, just hover the mouse over a cell to preview the description.
Images #
Explore every single image in the dataset with respect to the number of annotations of each class it has. Click a row to preview selected image. Sort by any column to find anomalies and edge cases. Use horizontal scroll if the table has many columns for a large number of classes in the dataset.
Object distribution #
Interactive heatmap chart for every class with object distribution shows how many images are in the dataset with a certain number of objects of a specific class. Users can click cell and see the list of all corresponding images.
Class sizes #
The table below gives various size properties of objects for every class. Click a row to see the image with annotations of the selected class. Sort columns to find classes with the smallest or largest objects or understand the size differences between classes.
Class | Object count | Avg area | Max area | Min area | Min height | Min height | Max height | Max height | Avg height | Avg height | Min width | Min width | Max width | Max width |
|---|---|---|---|---|---|---|---|---|---|---|---|---|---|---|
pigment network mask | 6122 | 2.57% | 77.81% | 0.06% | 19px | 3.12% | 4459px | 100% | 406px | 20.12% | 18px | 2.15% | 6648px | 100% |
globule mask | 3784 | 0.59% | 46.12% | 0.05% | 17px | 2.94% | 3278px | 100% | 209px | 10.17% | 17px | 2.22% | 3598px | 91.11% |
skin cancer mask | 3694 | 23.33% | 100% | 0.22% | 85px | 7.83% | 4479px | 100% | 1166px | 57.08% | 78px | 4.16% | 6708px | 100% |
milia like cyst mask | 3328 | 0.2% | 22.79% | 0.06% | 19px | 3.12% | 4091px | 92.75% | 156px | 6.5% | 18px | 2.19% | 5052px | 76.3% |
streaks mask | 585 | 0.47% | 10.27% | 0.06% | 18px | 3.28% | 3327px | 75.65% | 195px | 10.99% | 14px | 2.19% | 2836px | 70.31% |
negative network mask | 542 | 1.74% | 33.47% | 0.07% | 24px | 4.12% | 3416px | 76.92% | 409px | 18.41% | 29px | 2.93% | 6245px | 93.38% |
Spatial Heatmap #
The heatmaps below give the spatial distributions of all objects for every class. These visualizations provide insights into the most probable and rare object locations on the image. It helps analyze objects' placements in a dataset.
Objects #
Table contains all 18055 objects. Click a row to preview an image with annotations, and use search or pagination to navigate. Sort columns to find outliers in the dataset.
Object ID ㅤ | Class ㅤ | Image name click row to open | Image size height x width | Height ㅤ | Height ㅤ | Width ㅤ | Width ㅤ | Area ㅤ |
|---|---|---|---|---|---|---|---|---|
1➔ | skin cancer mask | ISIC_0023678.jpg | 2304 x 3072 | 972px | 42.19% | 840px | 27.34% | 8.73% |
2➔ | pigment network mask | ISIC_0023678.jpg | 2304 x 3072 | 356px | 15.45% | 453px | 14.75% | 0.97% |
3➔ | pigment network mask | ISIC_0023678.jpg | 2304 x 3072 | 113px | 4.9% | 94px | 3.06% | 0.1% |
4➔ | pigment network mask | ISIC_0023678.jpg | 2304 x 3072 | 192px | 8.33% | 175px | 5.7% | 0.2% |
5➔ | pigment network mask | ISIC_0023678.jpg | 2304 x 3072 | 116px | 5.03% | 189px | 6.15% | 0.2% |
6➔ | skin cancer mask | ISIC_0012643.jpg | 768 x 1024 | 426px | 55.47% | 608px | 59.38% | 25.34% |
7➔ | pigment network mask | ISIC_0012643.jpg | 768 x 1024 | 382px | 49.74% | 570px | 55.66% | 14.24% |
8➔ | skin cancer mask | ISIC_0019794.jpg | 480 x 640 | 85px | 17.71% | 78px | 12.19% | 1.33% |
9➔ | streaks mask | ISIC_0019794.jpg | 480 x 640 | 26px | 5.42% | 27px | 4.22% | 0.12% |
10➔ | streaks mask | ISIC_0019794.jpg | 480 x 640 | 48px | 10% | 32px | 5% | 0.29% |
License #
International Skin Imaging Collaboration Challenge 2018 is under CC BY-NC 4.0 license.
Citation #
If you make use of the ISIC Challenge 2018 data, please cite the following reference:
[1] Noel Codella, Veronica Rotemberg, Philipp Tschandl, M. Emre Celebi, Stephen Dusza, David Gutman, Brian Helba, Aadi Kalloo, Konstantinos Liopyris, Michael Marchetti, Harald Kittler, Allan Halpern:
"Skin Lesion Analysis Toward Melanoma Detection 2018: A Challenge Hosted by the International Skin Imaging Collaboration (ISIC)", 2018;
https://arxiv.org/abs/1902.03368

[2] Tschandl, P., Rosendahl, C. & Kittler, H.
The HAM10000 dataset, a large collection of multi-source dermatoscopic images of common pigmented skin lesions.
Sci. Data 5, 180161 doi:10.1038/sdata.2018.161 (2018).
If you are happy with Dataset Ninja and use provided visualizations and tools in your work, please cite us:
@misc{ visualization-tools-for-isic-challenge-dataset,
  title = { Visualization Tools for ISIC Challenge 2018 Dataset },
  type = { Computer Vision Tools },
  author = { Dataset Ninja },
  howpublished = { \url{ https://datasetninja.com/isic-challenge-2018 } },
  url = { https://datasetninja.com/isic-challenge-2018 },
  journal = { Dataset Ninja },
  publisher = { Dataset Ninja },
  year = { 2026 },
  month = { jul },
  note = { visited on 2026-07-27 },
}
Download #
Dataset ISIC Challenge 2018 can be downloaded in Supervisely format:
As an alternative, it can be downloaded with dataset-tools package:
pip install --upgrade dataset-tools
… using following python code:
import dataset_tools as dtools

dtools.download(dataset='ISIC Challenge 2018', dst_dir='~/dataset-ninja/')
Make sure not to overlook the python code example available on the Supervisely Developer Portal. It will give you a clear idea of how to effortlessly work with the downloaded dataset.
The data in original format can be downloaded here.
Disclaimer #
Our gal from the legal dep told us we need to post this:
Dataset Ninja provides visualizations and statistics for some datasets that can be found online and can be downloaded by general audience. Dataset Ninja is not a dataset hosting platform and can only be used for informational purposes. The platform does not claim any rights for the original content, including images, videos, annotations and descriptions. Joint publishing is prohibited.
You take full responsibility when you use datasets presented at Dataset Ninja, as well as other information, including visualizations and statistics we provide. You are in charge of compliance with any dataset license and all other permissions. You are required to navigate datasets homepage and make sure that you can use it. In case of any questions, get in touch with us at hello@datasetninja.com.