

Introduction #
This Makerere University Beans Image Dataset was created to provide an open and accessible, well labeled, sufficiently curated image dataset. This is to enable researchers to build various machine learning experiments to aid innovations that may include; bean crop disease diagnosis and spatial analysis. The dataset consists of bean image crops spread collected across the different regions in Uganda. Data were collected by random sampling from the areas where bean crop farming is practiced; these areas were identified by the experts. A few samples were collected from the identified areas to generate a dataset that represents the overall bean farming in the country.
Note, similar Makerere University Beans Image Dataset datasets are also available on the DatasetNinja.com:
- The KaraAgro AI Maize Dataset
- The KaraAgroAI Cocoa Dataset
- Makerere University Cassava Image Dataset
- Makerere University Maize Image Dataset
Motivation
The dataset was created to provide an open, well-labelled, sufficiently curated and accessible beans image dataset. Data scientists, researchers, and the broader machine learning community can use the dataset for various machine learning experiments to build beans crop disease diagnosis and spatial analysis solutions. Despite the agricultural sector being a key focus for national economic development in Sub-Saharan Africa, crop pests and diseases, particularly affecting vital food security crops like beans, have posed significant challenges. A 2020 study conducted on bean rust in Uganda revealed that the disease led to estimated losses ranging from 5% to 67% across the six varieties examined. Similarly, a 2017 study on Angular Leaf Spot (ALS) in the Sub-Saharan African region demonstrated that ALS contributed to an alarming yield loss estimated at 384.2 tons per year for the entire region (Kijana et al., 2017).
The current trend in data collection and crop pest and disease diagnosis is transitioning from identifying diseases based on visible symptoms to employing data-driven solutions that leverage machine learning and computer vision techniques. Smallholder farmers and agricultural experts are now equipped with mobile phones loaded with software, enabling them to automatically collect field-level geo-coded and time-stamped data. Despite these advancements, the image data collected in the past has not been adequately curated and shared with the broader machine learning community.
Dataset Creation
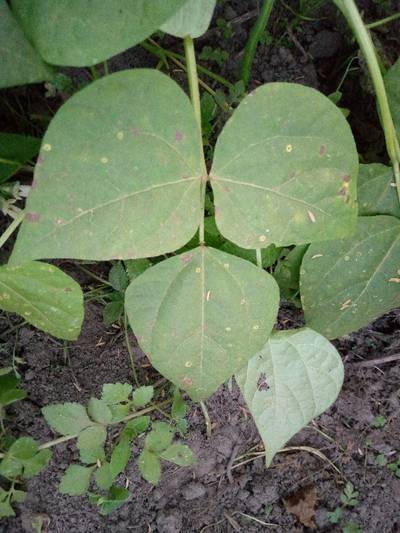
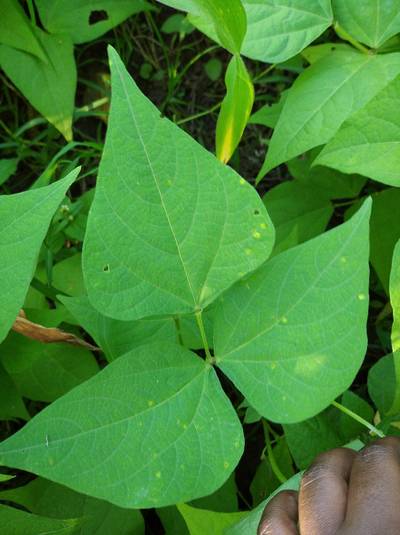
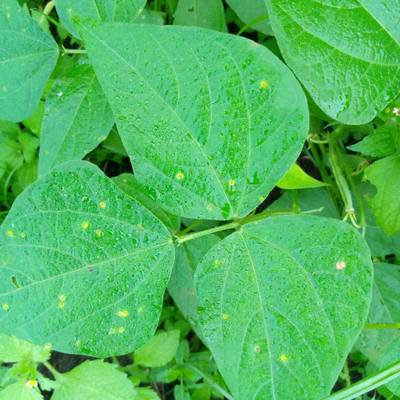
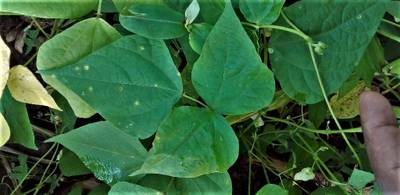
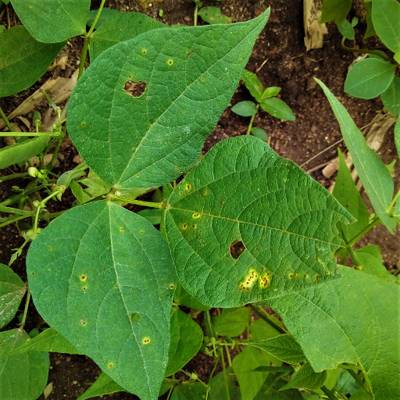
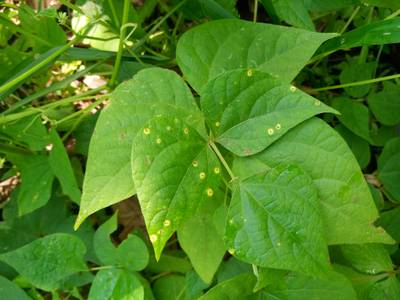
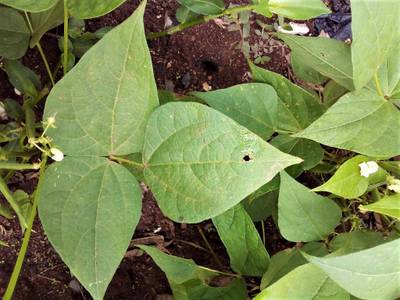
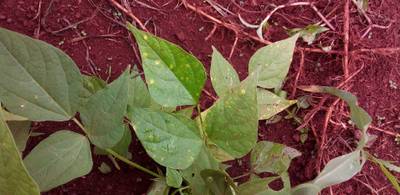
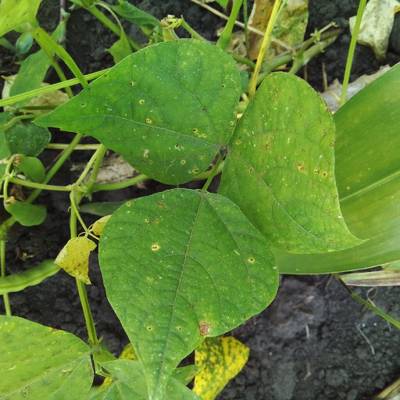
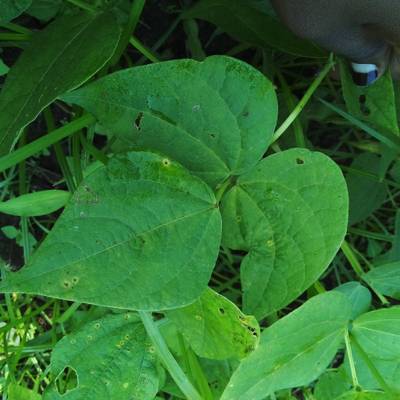
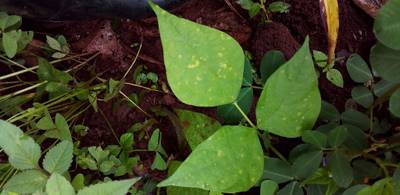
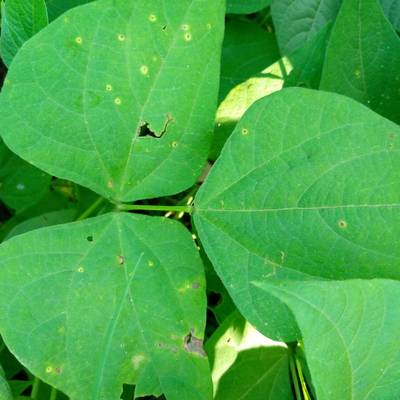
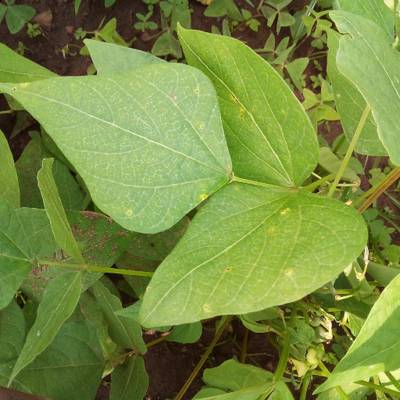
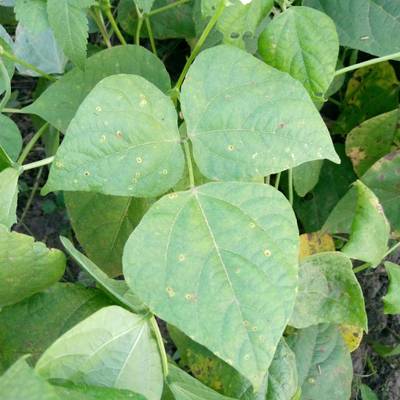
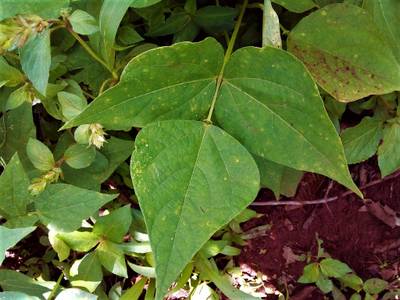
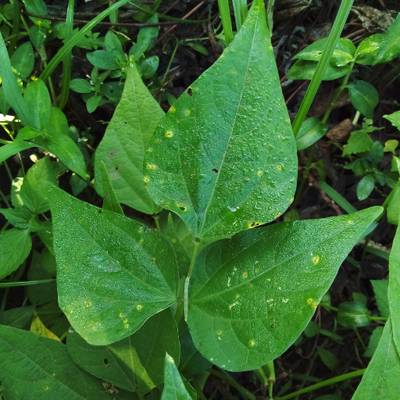
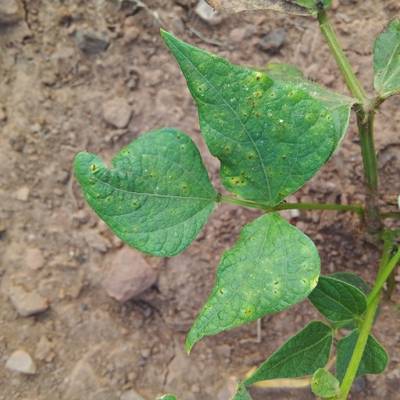
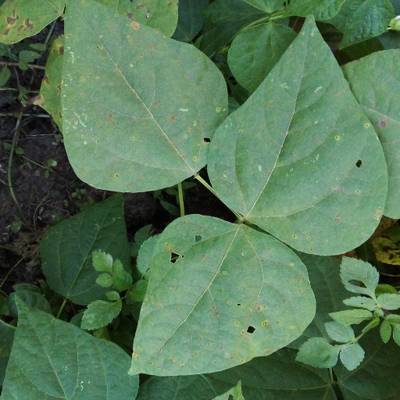
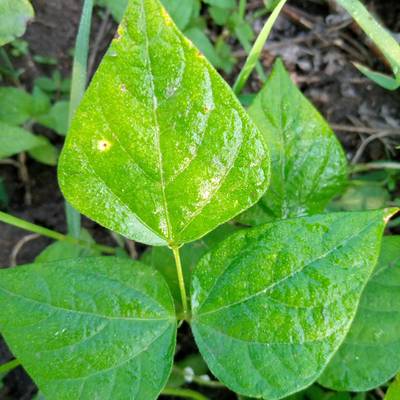
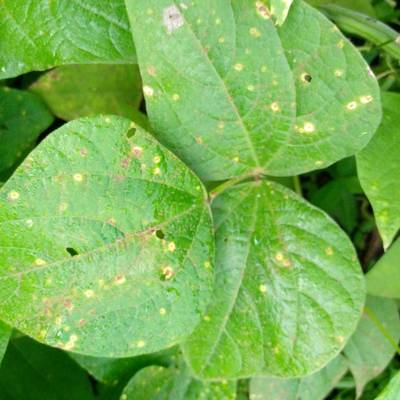
The dataset was created by a team of scientists from the Makerere Artificial Intelligence Lab, Marconi Society Machine Learning Laboratory Lab, and the National Crops Resources Research Institute (NaCRRI) in active collaboration. NaCRRI is an institute of the National Agricultural Research Organization (NARO) in charge of crop research in Uganda. The dataset includes bean crop trifoliate images, each instance includes the trifoliate image accompanied by the image category, i.e., healthy, bean rust, angular leaf spot(als), and a group of attributes associated with the crops from which the image was taken.

Beans Data Class Labels.
The dataset consists of bean image crops spread collected across the different regions in Uganda. Data were collected by random sampling from the areas where bean crop farming is practiced; these areas were identified by the experts. A few samples were collected from the identified areas to generate a dataset that represents the overall bean farming in the country. Each instance includes a trifoliate image, accompanied with attributes; the crop variety, plant age, district, subcounty and the date of image capture. Each instance is associated with a class label to assert whether or not it was taken from a diseased crop. There are no relationships between the different image instances in the dataset.
Collection Process
The beans image data was collected using mobile phones from bean farmer gardens. The data was collected using the Adsurv application, which is a mobile application that enables crowdsourcing of crop disease data from farmers’ gardens. Android devices were available for data collection. Each device was configured
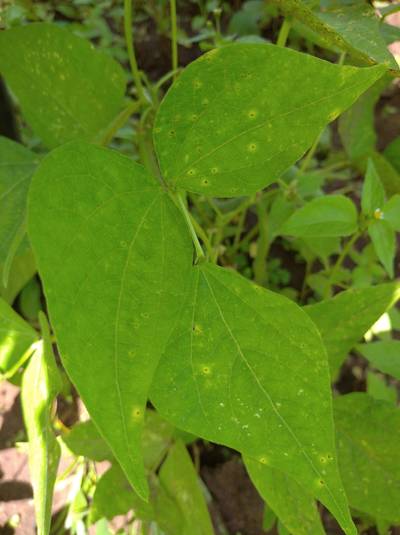
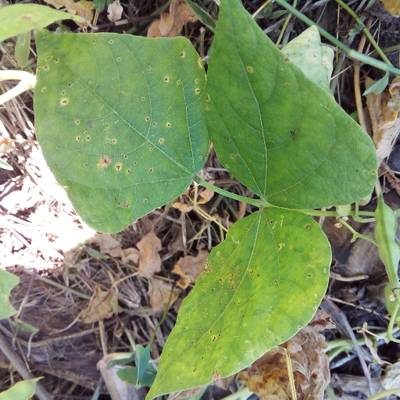
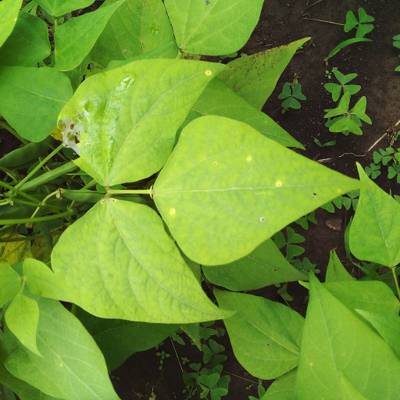
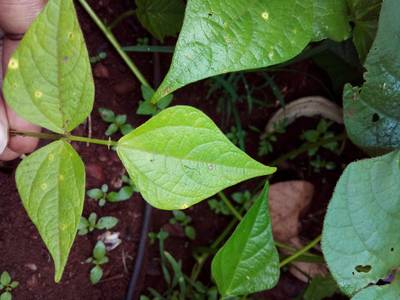
with Adsurv for a specific data collector. The overall data collection exercise was conducted by a team including researchers from the Makerere Artificial Intelligence research Lab, the Marconi Society Machine Learning Laboratory at Makerere University and agricultural experts from Legumes program at the National Crops Resources Research Institute and an agricultural extension worker. The time frame matches the creation time frame of the date associated with the instances. For quality assurance data cleaning was done taking into consideration the missing values, defective images, resolution of inconsistencies, and removal of outliers. During data collection process, the data collectors had to manually input some values for predefined attributes; for example, crop variety, however, some of these attributes changed. Some of the images were taken in the middle of the day which led to an overexposure defect as a result of too much light hitting the camera sensor. This affected the quality of the images making it difficult to see the disease symptoms. These images were preprocessed to minimize the overexposure defect.

On the left is the trifoliate image after preprocessing, on the right is the original trifoliate image with the overexposure defect.
 Homepage
 Datasheet
Summary #
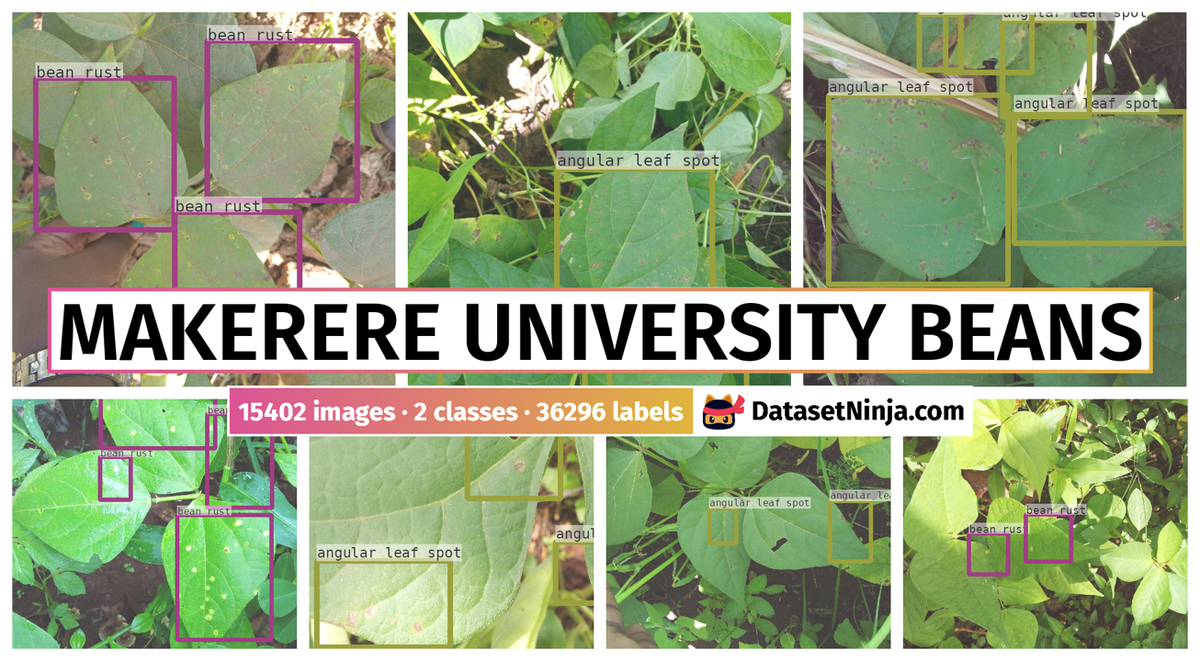
Makerere University Beans Image Dataset is a dataset for an object detection task. It is used in the agricultural industry.
The dataset consists of 15402 images with 36296 labeled objects belonging to 2 different classes including angular leaf spot and bean rust.
Images in the Makerere University Beans dataset have bounding box annotations. There are 5304 (34% of the total) unlabeled images (i.e. without annotations). There are no pre-defined train/val/test splits in the dataset. Alternatively, the dataset could be split into 3 health statuses: healthy (5284 images), als (5098 images), and bean rust (5020 images). Additionally, every image marked with the variety, age, district, datetime, subcounty, has other symptoms tags. The dataset was released in 2022 by the University of Ghana.
Explore #
Makerere University Beans dataset has 15402 images. Click on one of the examples below or open "Explore" tool anytime you need to view dataset images with annotations. This tool has extended visualization capabilities like zoom, translation, objects table, custom filters and more. Hover the mouse over the images to hide or show annotations.


Class balance #
There are 2 annotation classes in the dataset. Find the general statistics and balances for every class in the table below. Click any row to preview images that have labels of the selected class. Sort by column to find the most rare or prevalent classes.

Class ㅤ | Images ㅤ | Objects ㅤ | Count on image average | Area on image average |
|---|---|---|---|---|
angular leaf spot➔ rectangle | 5087 | 17342 | 3.41 | 36.7% |
bean rust➔ rectangle | 5011 | 18954 | 3.78 | 32.63% |
Co-occurrence matrix #
Co-occurrence matrix is an extremely valuable tool that shows you the images for every pair of classes: how many images have objects of both classes at the same time. If you click any cell, you will see those images. We added the tooltip with an explanation for every cell for your convenience, just hover the mouse over a cell to preview the description.
Images #
Explore every single image in the dataset with respect to the number of annotations of each class it has. Click a row to preview selected image. Sort by any column to find anomalies and edge cases. Use horizontal scroll if the table has many columns for a large number of classes in the dataset.
Object distribution #
Interactive heatmap chart for every class with object distribution shows how many images are in the dataset with a certain number of objects of a specific class. Users can click cell and see the list of all corresponding images.
Class sizes #
The table below gives various size properties of objects for every class. Click a row to see the image with annotations of the selected class. Sort columns to find classes with the smallest or largest objects or understand the size differences between classes.
Class | Object count | Avg area | Max area | Min area | Min height | Min height | Max height | Max height | Avg height | Avg height | Min width | Min width | Max width | Max width |
|---|---|---|---|---|---|---|---|---|---|---|---|---|---|---|
bean rust rectangle | 18954 | 8.89% | 56.56% | 0.03% | 2px | 0.4% | 1542px | 83.13% | 276px | 28.17% | 15px | 1.46% | 1735px | 83.59% |
angular leaf spot rectangle | 17342 | 11.25% | 73.54% | 0.07% | 2px | 0.4% | 2457px | 91.99% | 318px | 32.22% | 26px | 2.54% | 1901px | 95.21% |
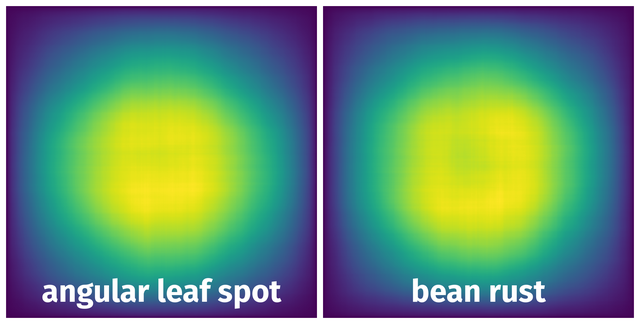
Spatial Heatmap #
The heatmaps below give the spatial distributions of all objects for every class. These visualizations provide insights into the most probable and rare object locations on the image. It helps analyze objects' placements in a dataset.
Objects #
Table contains all 36296 objects. Click a row to preview an image with annotations, and use search or pagination to navigate. Sort columns to find outliers in the dataset.
Object ID ㅤ | Class ㅤ | Image name click row to open | Image size height x width | Height ㅤ | Height ㅤ | Width ㅤ | Width ㅤ | Area ㅤ |
|---|---|---|---|---|---|---|---|---|
1➔ | angular leaf spot rectangle | 1621928221687.jpg | 765 x 1024 | 317px | 41.44% | 478px | 46.68% | 19.34% |
2➔ | angular leaf spot rectangle | 1621928221687.jpg | 765 x 1024 | 522px | 68.24% | 364px | 35.55% | 24.26% |
3➔ | angular leaf spot rectangle | 1621928221687.jpg | 765 x 1024 | 338px | 44.18% | 386px | 37.7% | 16.65% |
4➔ | bean rust rectangle | 1619077894873.jpg | 3456 x 4608 | 1275px | 36.89% | 825px | 17.9% | 6.61% |
5➔ | bean rust rectangle | 1619077894873.jpg | 3456 x 4608 | 1542px | 44.62% | 889px | 19.29% | 8.61% |
6➔ | bean rust rectangle | 1619077894873.jpg | 3456 x 4608 | 1237px | 35.79% | 1655px | 35.92% | 12.86% |
7➔ | bean rust rectangle | 1619077894873.jpg | 3456 x 4608 | 327px | 9.46% | 483px | 10.48% | 0.99% |
8➔ | bean rust rectangle | 1619077894873.jpg | 3456 x 4608 | 525px | 15.19% | 509px | 11.05% | 1.68% |
9➔ | bean rust rectangle | 1619345601162.jpg | 498 x 1024 | 65px | 13.05% | 72px | 7.03% | 0.92% |
10➔ | angular leaf spot rectangle | 1621597817028.jpg | 1024 x 1024 | 275px | 26.86% | 271px | 26.46% | 7.11% |
License #
Citation #
If you make use of the makerere university beans data, please cite the following reference:
@data{DVN/TCKVEW_2022,
  author = {Mugalu, Ben-Wycliff and Nakatumba-Nabende, Joyce and Katumba, Andrew and Babirye, Claire and Tusubira, Francis-Jeremy and Mutebi, Chodrine and Nsumba, Solomon and Namanya, Gloria},
  publisher = {Harvard Dataverse},
  title = {{Makerere University Beans Image Dataset}},
  year = {2022},
  version = {V2},
  doi = {10.7910/DVN/TCKVEW},
  url = {https://doi.org/10.7910/DVN/TCKVEW}
}
If you are happy with Dataset Ninja and use provided visualizations and tools in your work, please cite us:
@misc{ visualization-tools-for-makerere-university-beans-dataset,
  title = { Visualization Tools for Makerere University Beans Dataset },
  type = { Computer Vision Tools },
  author = { Dataset Ninja },
  howpublished = { \url{ https://datasetninja.com/makerere-university-beans } },
  url = { https://datasetninja.com/makerere-university-beans },
  journal = { Dataset Ninja },
  publisher = { Dataset Ninja },
  year = { 2026 },
  month = { aug },
  note = { visited on 2026-08-02 },
}
Download #
Dataset Makerere University Beans can be downloaded in Supervisely format:
As an alternative, it can be downloaded with dataset-tools package:
pip install --upgrade dataset-tools
… using following python code:
import dataset_tools as dtools

dtools.download(dataset='Makerere University Beans', dst_dir='~/dataset-ninja/')
Make sure not to overlook the python code example available on the Supervisely Developer Portal. It will give you a clear idea of how to effortlessly work with the downloaded dataset.
The data in original format can be downloaded here.
Disclaimer #
Our gal from the legal dep told us we need to post this:
Dataset Ninja provides visualizations and statistics for some datasets that can be found online and can be downloaded by general audience. Dataset Ninja is not a dataset hosting platform and can only be used for informational purposes. The platform does not claim any rights for the original content, including images, videos, annotations and descriptions. Joint publishing is prohibited.
You take full responsibility when you use datasets presented at Dataset Ninja, as well as other information, including visualizations and statistics we provide. You are in charge of compliance with any dataset license and all other permissions. You are required to navigate datasets homepage and make sure that you can use it. In case of any questions, get in touch with us at hello@datasetninja.com.