

Introduction #
The Makerere University Maize Image Dataset was created to provide an open, well-labelled, sufficiently curated and accessible maize image dataset. Data scientists, researchers, and the broader machine learning community can use the dataset for various machine learning experiments to build maize crop disease diagnosis and spatial analysis solutions. The dataset contains maize image data collected across the different regions in Uganda. The dataset has image samples collected from significant maize growing districts selected with the guidance of agricultural experts to obtain a representative dataset.
Note, similar Makerere University Maize Image Dataset datasets are also available on the DatasetNinja.com:
- The KaraAgro AI Maize Dataset
- The KaraAgroAI Cocoa Dataset
- Makerere University Beans Image Dataset
- Makerere University Cassava Image Dataset
Motivation
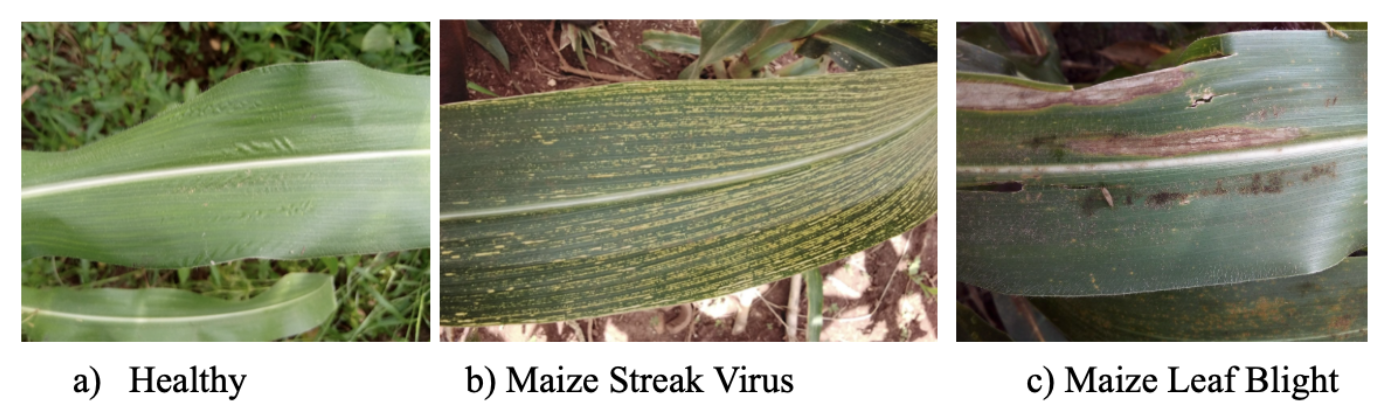
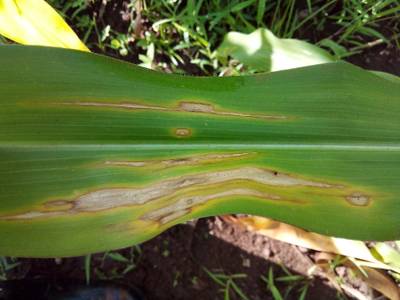
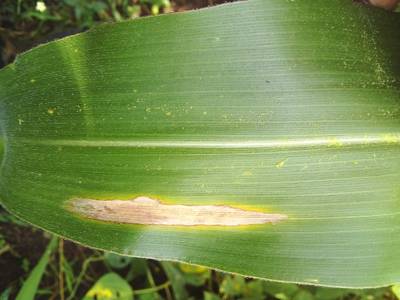
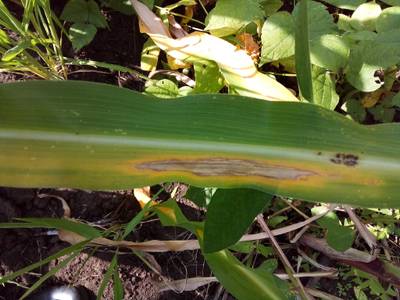
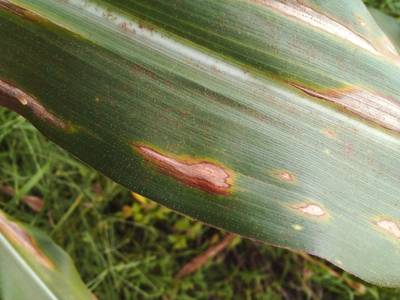
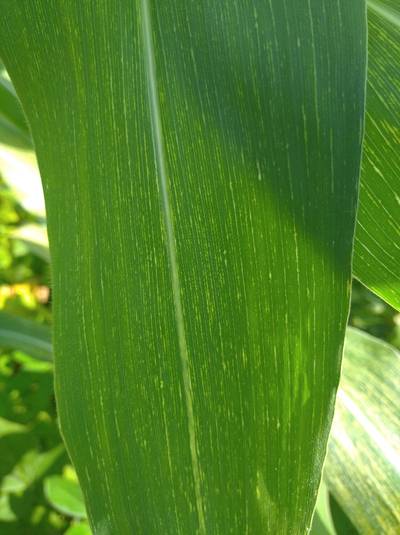
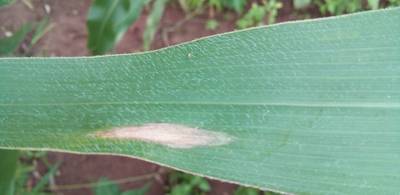
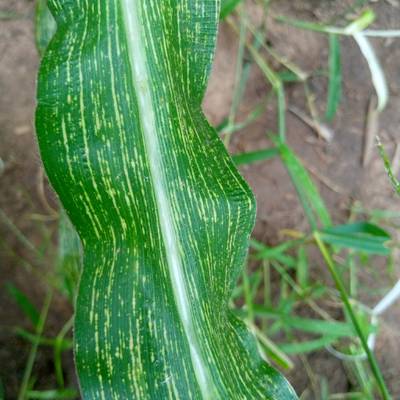
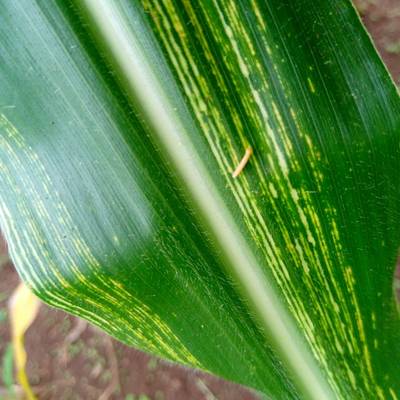
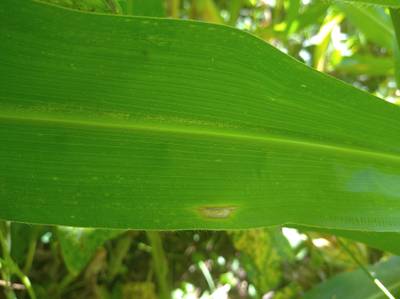
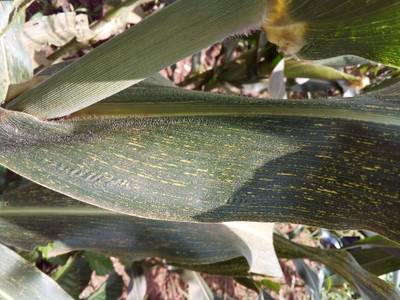
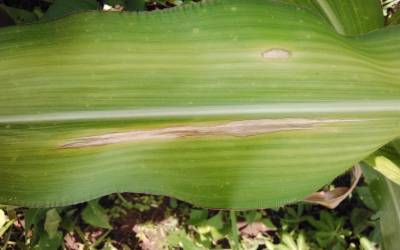
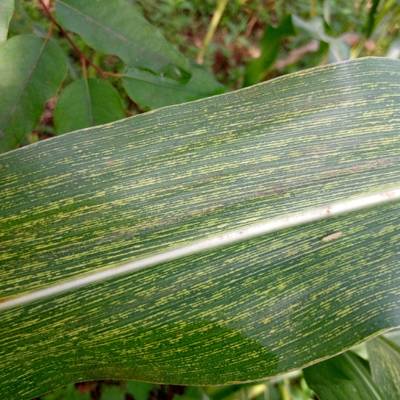
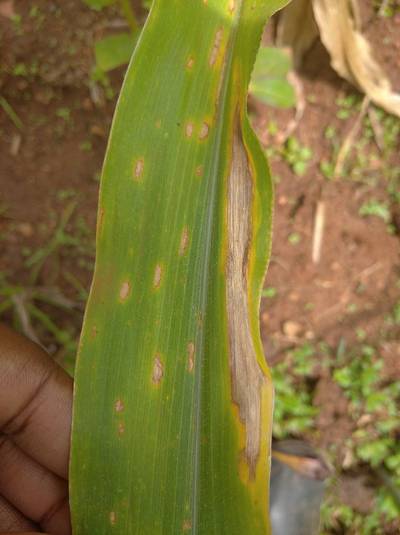
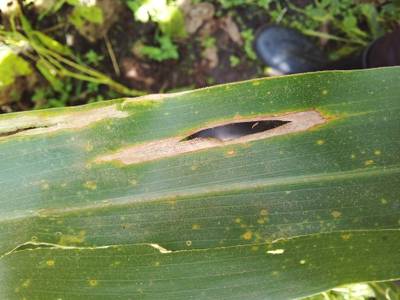
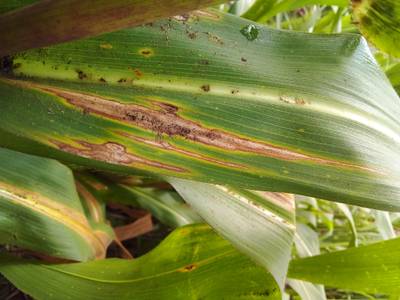
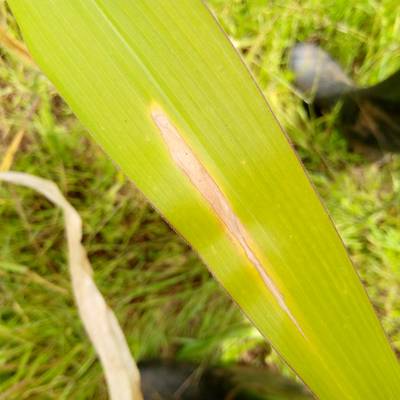
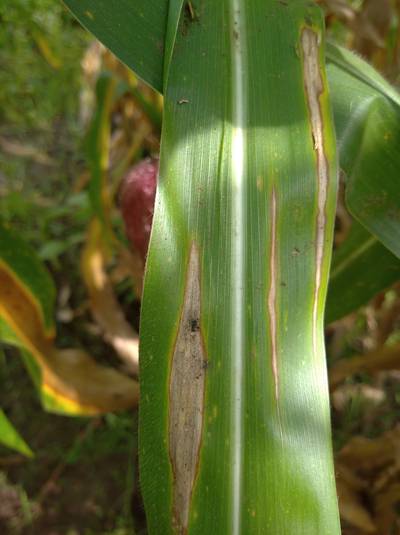
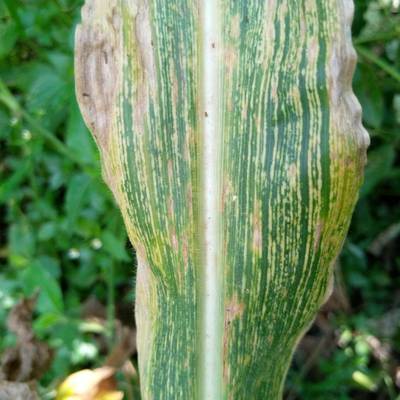
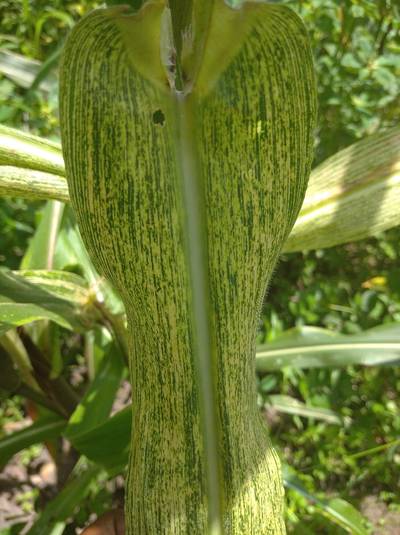
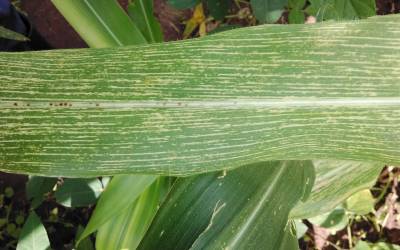
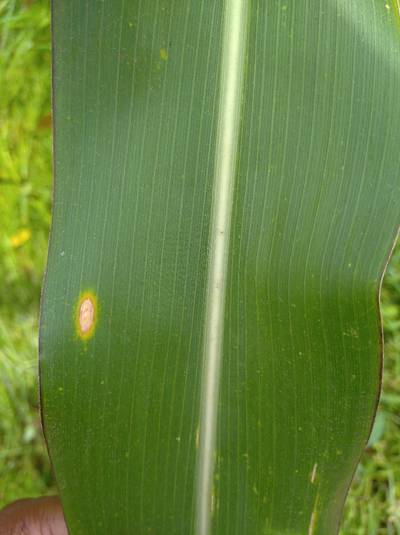
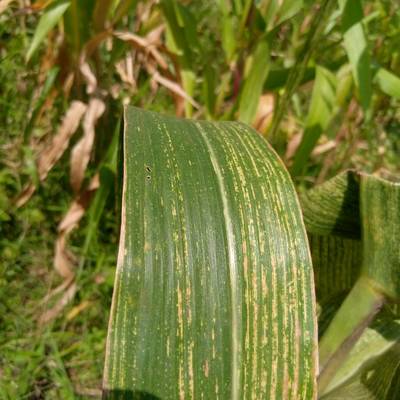
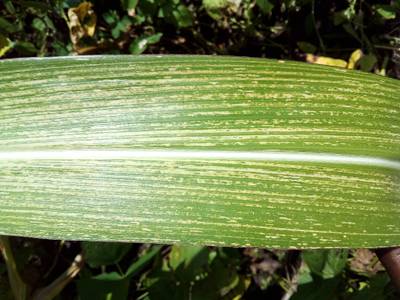
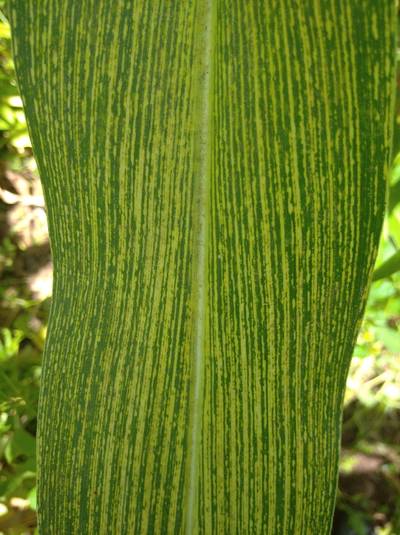
While the agricultural sector holds a prominent position in the national economic development agenda of Sub-Saharan Africa, it grapples with challenges posed by crop pests and diseases, particularly affecting crucial food security crops such as Maize. Over the past decade, Maize Leaf Blight disease, also known as Northern Corn Leaf Blight, has emerged as a significant threat in lowland agro-ecological zones. Simultaneously, Maize Streak Disease, caused by the Maize Streak Virus, ranks as the third most serious ailment impacting maize in Sub-Saharan Africa. The prevalence of these diseases has significantly hampered maize yields.
The current approach to data collection and crop pest and disease diagnosis is undergoing a transition from relying on visible symptoms for disease identification to employing data-driven solutions that incorporate machine learning and computer vision techniques. Despite these advancements, the image data previously collected remains inadequately curated, prepared, and shared within the broader community.
Dataset Creation
The dataset was created by scientists from the Makerere Artificial Intelligence Lab and the National Crops Resources Research Institute (NaCRRI) in Namulonge,
Uganda. NaCRRI is an institute of the National Agricultural Research Organisation (NARO) in charge of crop research. Each instance is associated with a class label based on the status of the crop: healthy or diseased. The dataset consists of a crop image with an image status, i.e., healthy, Maize Leaf Blight (mlb), Maize Streak Virus (msv).
Maize Data Labels.
The dataset contains maize image data collected across the different regions in Uganda. The dataset has image samples collected from significant maize growing districts selected with the guidance of agricultural experts to obtain a representative dataset. The data consists of raw image data. Each image data point is accompanied with attributes; the crop variety, plant age, district, subcounty, and the datetime of image capture. There are no relationships between the different image instances in the dataset.
Collection Process
The maize image data was collected using mobile phones from farmer gardens. The gardens were identified within the maize growing prominent districts across the four regions in Uganda. The data was collected using the Adsurv application, which is a mobile application that enables crowdsourcing of crop disease data from farmers’ gardens. Adsurv application was installed on mobile phones/tablets used during the data collection process.
Individuals involved in the data collection process included a team of researchers from the Makerere Artificial Intelligence Lab, an agricultural expert affiliated with the cereals program at the National Crops Resources Research Institute (NaCRRI), and a district agricultural officer.
The authors conducted thorough data cleaning procedures, eliminating blurry images, those captured under direct sunlight, and resolving inconsistencies in resolution. In certain instances, data collectors manually input image attribute variables such as crop variety. Modifications to predetermined attributes like districts and sub-counties were made during the data collection phase, leading to inconsistencies in the generated dataset. These inconsistencies manifested as variations in reporting and corrections to district/sub-county information when data had been collected from a different location. The resolution of these inconsistencies was addressed during the subsequent data cleaning process.
 Homepage
 Datasheet
Summary #
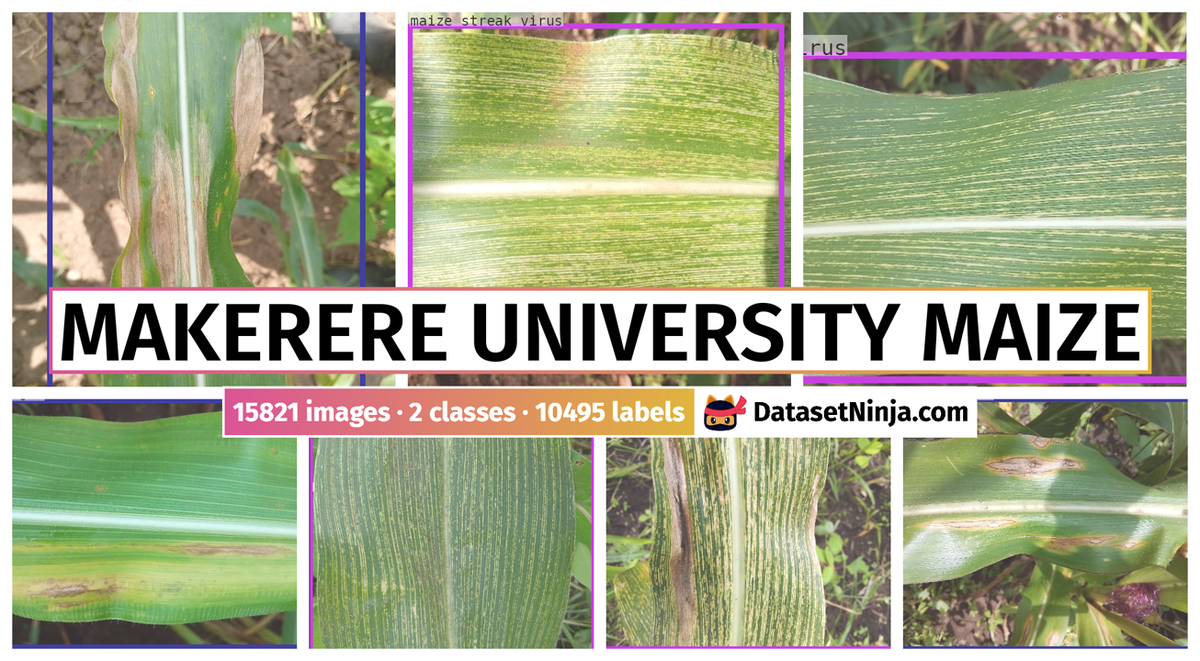
Makerere University Maize Image Dataset is a dataset for an object detection task. It is used in the agricultural industry.
The dataset consists of 15821 images with 10495 labeled objects belonging to 2 different classes including maize leaf blight and maize streak virus.
Images in the Makerere University Maize dataset have bounding box annotations. There are 5326 (34% of the total) unlabeled images (i.e. without annotations). There are no pre-defined train/val/test splits in the dataset. Alternatively, the dataset could be split into 3 health statuses: healthy (5326 images), mlb (5279 images), and msv (5216 images). Additionally, every image marked with the variety, age, district, datetime, subcounty tags. The dataset was released in 2022 by the University of Ghana.
Explore #
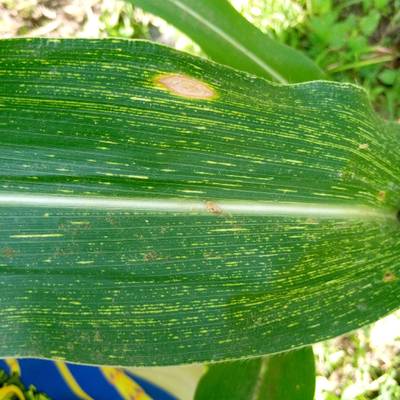
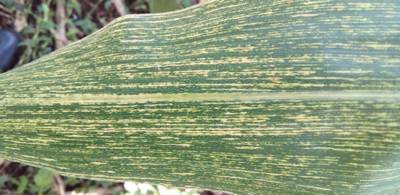
Makerere University Maize dataset has 15821 images. Click on one of the examples below or open "Explore" tool anytime you need to view dataset images with annotations. This tool has extended visualization capabilities like zoom, translation, objects table, custom filters and more. Hover the mouse over the images to hide or show annotations.


Class balance #
There are 2 annotation classes in the dataset. Find the general statistics and balances for every class in the table below. Click any row to preview images that have labels of the selected class. Sort by column to find the most rare or prevalent classes.

Class ㅤ | Images ㅤ | Objects ㅤ | Count on image average | Area on image average |
|---|---|---|---|---|
maize leaf blight➔ rectangle | 5279 | 5279 | 1 | 93.94% |
maize streak virus➔ rectangle | 5216 | 5216 | 1 | 94.34% |
Co-occurrence matrix #
Co-occurrence matrix is an extremely valuable tool that shows you the images for every pair of classes: how many images have objects of both classes at the same time. If you click any cell, you will see those images. We added the tooltip with an explanation for every cell for your convenience, just hover the mouse over a cell to preview the description.
Images #
Explore every single image in the dataset with respect to the number of annotations of each class it has. Click a row to preview selected image. Sort by any column to find anomalies and edge cases. Use horizontal scroll if the table has many columns for a large number of classes in the dataset.
Object distribution #
Interactive heatmap chart for every class with object distribution shows how many images are in the dataset with a certain number of objects of a specific class. Users can click cell and see the list of all corresponding images.
Class sizes #
The table below gives various size properties of objects for every class. Click a row to see the image with annotations of the selected class. Sort columns to find classes with the smallest or largest objects or understand the size differences between classes.
Class | Object count | Avg area | Max area | Min area | Min height | Min height | Max height | Max height | Avg height | Avg height | Min width | Min width | Max width | Max width |
|---|---|---|---|---|---|---|---|---|---|---|---|---|---|---|
maize leaf blight rectangle | 5279 | 93.94% | 99.9% | 3.46% | 82px | 16.47% | 4031px | 100% | 869px | 95.75% | 119px | 15.56% | 3198px | 100% |
maize streak virus rectangle | 5216 | 94.34% | 100% | 17.36% | 268px | 32.03% | 4028px | 100% | 895px | 96.3% | 373px | 36.43% | 3192px | 100% |
Spatial Heatmap #
The heatmaps below give the spatial distributions of all objects for every class. These visualizations provide insights into the most probable and rare object locations on the image. It helps analyze objects' placements in a dataset.
Objects #
Table contains all 10495 objects. Click a row to preview an image with annotations, and use search or pagination to navigate. Sort columns to find outliers in the dataset.
Object ID ㅤ | Class ㅤ | Image name click row to open | Image size height x width | Height ㅤ | Height ㅤ | Width ㅤ | Width ㅤ | Area ㅤ |
|---|---|---|---|---|---|---|---|---|
1➔ | maize leaf blight rectangle | 1621583746140.jpg | 1024 x 1024 | 1015px | 99.12% | 1018px | 99.41% | 98.54% |
2➔ | maize streak virus rectangle | 1621420515944.jpg | 1024 x 1024 | 1016px | 99.22% | 1014px | 99.02% | 98.25% |
3➔ | maize leaf blight rectangle | 1621503689016.jpg | 1024 x 1024 | 659px | 64.36% | 1018px | 99.41% | 63.98% |
4➔ | maize streak virus rectangle | 1621405420241.jpg | 2000 x 3200 | 1938px | 96.9% | 3158px | 98.69% | 95.63% |
5➔ | maize leaf blight rectangle | 1621319539757.jpg | 2000 x 3200 | 1984px | 99.2% | 3186px | 99.56% | 98.77% |
6➔ | maize streak virus rectangle | 1621774487517.jpg | 765 x 1024 | 760px | 99.35% | 1021px | 99.71% | 99.06% |
7➔ | maize leaf blight rectangle | 1621683245250.jpg | 1024 x 1024 | 1023px | 99.9% | 1021px | 99.71% | 99.61% |
8➔ | maize leaf blight rectangle | 1621583672860.jpg | 1024 x 1024 | 1020px | 99.61% | 970px | 94.73% | 94.36% |
9➔ | maize leaf blight rectangle | 1621402504326.jpg | 768 x 1024 | 751px | 97.79% | 1014px | 99.02% | 96.83% |
10➔ | maize leaf blight rectangle | 1621749048951.jpg | 498 x 1024 | 494px | 99.2% | 1021px | 99.71% | 98.91% |
License #
Citation #
If you make use of the makerere university maize data, please cite the following reference:
@dataset{makerere university maize,
  author={Babirye, Claire and Nakatumba-Nabende, Joyce and Namanya, Gloria and Mutebi, Chodrine and Ebellu, Moses and Murungi, Joab and Tobius, Saolo and Ssemwogerere, Jonah and Nakayima, Annet and Nabagereka, Deborah and Asasira, Judith and Kanyesigye, Ruth},
  title={Makerere University Maize Image Dataset},
  year={2022},
  url={https://dataverse.harvard.edu/dataset.xhtml?persistentId=doi:10.7910/DVN/LPGHKK}
}
If you are happy with Dataset Ninja and use provided visualizations and tools in your work, please cite us:
@misc{ visualization-tools-for-makerere-university-maize-dataset,
  title = { Visualization Tools for Makerere University Maize Dataset },
  type = { Computer Vision Tools },
  author = { Dataset Ninja },
  howpublished = { \url{ https://datasetninja.com/makerere-university-maize } },
  url = { https://datasetninja.com/makerere-university-maize },
  journal = { Dataset Ninja },
  publisher = { Dataset Ninja },
  year = { 2026 },
  month = { aug },
  note = { visited on 2026-08-01 },
}
Download #
Dataset Makerere University Maize can be downloaded in Supervisely format:
As an alternative, it can be downloaded with dataset-tools package:
pip install --upgrade dataset-tools
… using following python code:
import dataset_tools as dtools

dtools.download(dataset='Makerere University Maize', dst_dir='~/dataset-ninja/')
Make sure not to overlook the python code example available on the Supervisely Developer Portal. It will give you a clear idea of how to effortlessly work with the downloaded dataset.
The data in original format can be downloaded here.
Disclaimer #
Our gal from the legal dep told us we need to post this:
Dataset Ninja provides visualizations and statistics for some datasets that can be found online and can be downloaded by general audience. Dataset Ninja is not a dataset hosting platform and can only be used for informational purposes. The platform does not claim any rights for the original content, including images, videos, annotations and descriptions. Joint publishing is prohibited.
You take full responsibility when you use datasets presented at Dataset Ninja, as well as other information, including visualizations and statistics we provide. You are in charge of compliance with any dataset license and all other permissions. You are required to navigate datasets homepage and make sure that you can use it. In case of any questions, get in touch with us at hello@datasetninja.com.