Introduction #
The Makerere University Cassava Image Dataset was created to provide an open and accessible cassava dataset with well-labeled, sufficiently curated, and prepared cassava crop imagery. Data scientists, researchers, and the broader machine learning community can use the dataset for various machine learning experiments to build cassava crop disease diagnosis and spatial analysis solutions. The dataset encompasses various instances captured in the Central, Eastern, Northern, and Western regions of Uganda. A subset of samples was specifically collected from prominent cassava-growing districts within these regions, as chosen by agricultural experts, aiming to construct a comprehensive and representative dataset.
Note, similar Makerere University Cassava Image Dataset datasets are also available on the DatasetNinja.com:
- The KaraAgro AI Maize Dataset
- The KaraAgroAI Cocoa Dataset
- Makerere University Beans Image Dataset
- Makerere University Maize Image Dataset
Motivation
Previous cassava image datasets encountered challenges such as mislabeling of classes and limited applicability in real-world agricultural settings due to their origin in laboratory settings. Recognizing the necessity for a high-quality, accurately labeled cassava image dataset reflecting diverse crop conditions—both healthy and diseased—and captured in authentic farmer gardens, efforts were made to address this gap. The current landscape of data collection and crop pest and disease diagnosis is shifting from reliance on visible symptoms to the adoption of data-driven solutions utilizing machine learning and computer vision techniques.
Smallholder farmers and agricultural experts now utilize mobile phones equipped with software to automatically gather field-level geo-coded and time-stamped data. Despite these advancements, the previously collected image data lacks comprehensive curation and has not been effectively shared with the broader machine learning community. The dataset was created by scientists from the Makerere Artificial Intelligence Lab and the National Crops Resources Research Institute (NaCRRI) in Namulonge, Uganda. NaCRRI is an institute of the National Agricultural Research Organisation (NARO) in charge of crop research.
Dataset Creation
The dataset encompasses various instances captured in the Central, Eastern, Northern, and Western regions of Uganda. A subset of samples was specifically collected from prominent cassava-growing districts within these regions, as chosen by agricultural experts, aiming to construct a comprehensive and representative dataset. Although the initial intention was to ensure an equal representation from each region, logistical constraints emerged, leading to a variation in district visits by the authors.
This deviation from the original plan occurred because certain regions were visited less frequently. This discrepancy arose due to the scarcity of data in some districts, either because they were predominantly urban centers or experienced minimal disease incidence owing to seasonal variations. The given labels per image are: healthy, Cassava Mosaic Disease(cmd) and Cassava Brown Streak Disease(cbsd).
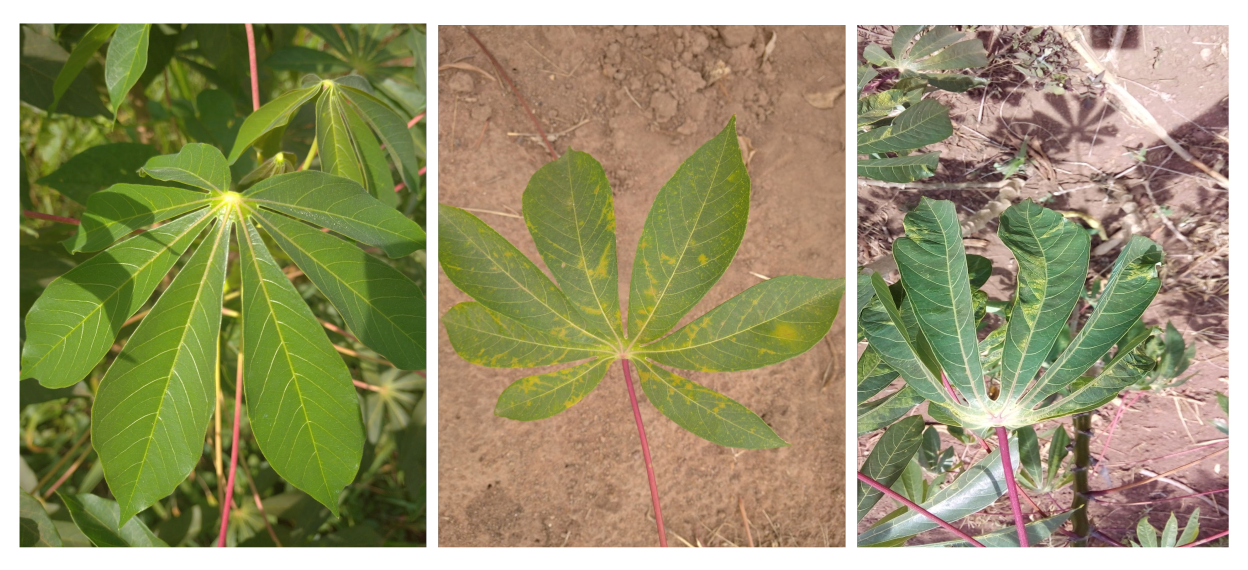
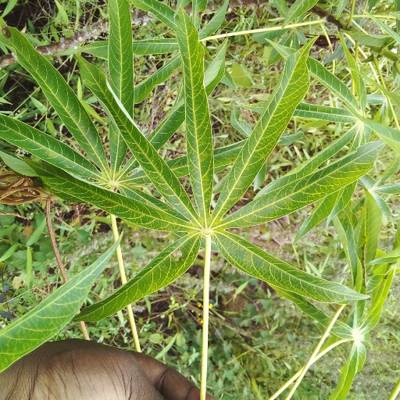
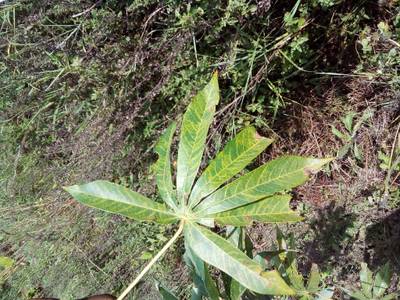
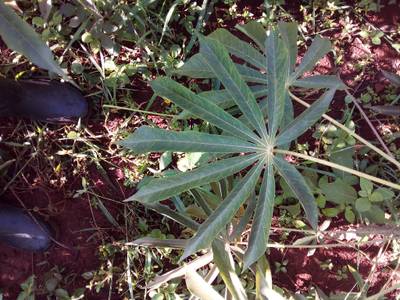
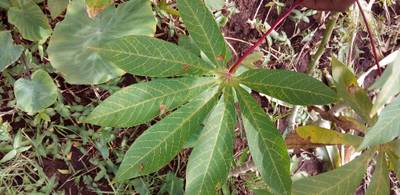
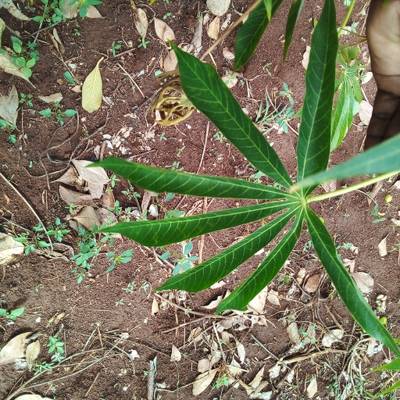
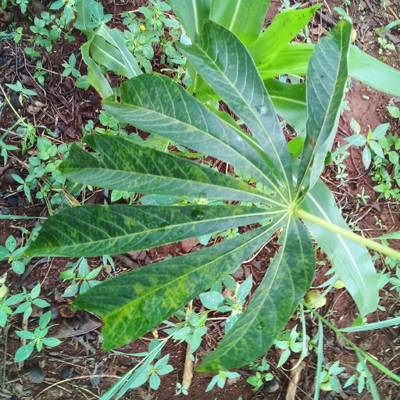
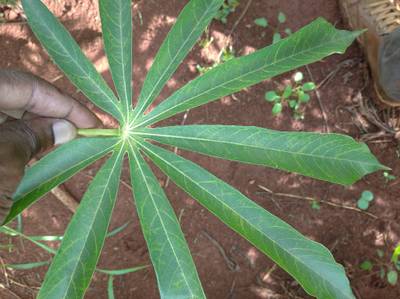
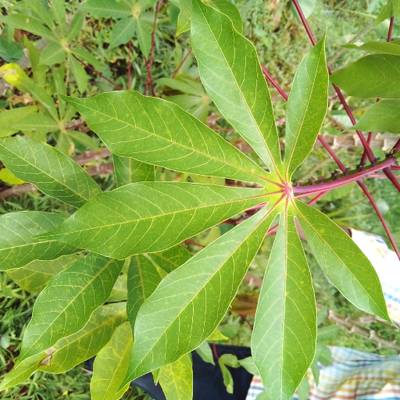
Image samples from the cassava dataset showing healthy image on the left, Cassava Brown Streak Image in the middle and Cassava Mosaic image on the right.
In the data collected in May 2021, certain instances lack the precise name of the local cassava variety, and in such cases, they were categorized as “local.” This classification was necessary because agricultural experts faced challenges in accurately determining the specific cassava variety. Notably, data collected before May 2021 lacks information on age and variety, as these details were not part of the data collection requirements during that period. There are no relationships between the different image instances in the dataset.
Collection Process
The Cassava image data was collected using mobile phones from farmer gardens. The gardens were identified within the different cassava growing prominent districts across the four regions in Uganda.For some of the data instances, the location attribute was generated by analyzing the GPS coordinate to identify the sub county. The images were taken with Android smartphones equipped with a form-based application supported by ODK1. Collaborating closely with agricultural experts in the domain, the data collection forms were meticulously designed, validated, and tested to accurately represent and capture the relevant attributes within the application. Sample data collection activities were carried out to validate and refine the data collection forms, and in-built validations were implemented to enhance data quality. These validations encompassed type validation for specific attributes, such as numbers, mandatory field requirements, and the utilization of predefined values for disease selection.
To facilitate seamless tracking and error containment, a distinct account was established for each data collector. The data collection process employed the Adsurv mobile application, a software program equipped with a module that facilitates the crowdsourcing of crop disease surveillance data directly from farmers’ gardens. The Adsurv application was installed on mobile phones and tablets utilized during the data collection phase.
Individuals involved in the data collection process included a team of researchers from the Makerere Artificial Intelligence Lab, an agricultural expert affiliated with the cereals program at the National Crops Resources Research Institute (NaCRRI), and a district agricultural officer.
Cleaning of the data was done after data collection to rectify some errors that were created during collection. This included visually checking for images to ensure that they all showed the objects of interest which are the cassava leaves and all other unrelated objects were discarded. Verification of the variety names was also done and some of the variety names were corrected to reflect the correct and consistent spellings through consultation with the agricultural experts at the Namulonge Agricultural Research Institute.
Summary #
Makerere University Cassava Image Dataset is a dataset for an object detection task. It is used in the agricultural industry.
The dataset consists of 9103 images with 3152 labeled objects belonging to 1 single class (cassava brown streak disease).
Images in the Makerere University Cassava dataset have bounding box annotations. There are 6110 (67% of the total) unlabeled images (i.e. without annotations). There are no pre-defined train/val/test splits in the dataset. Alternatively, the dataset could be split into 3 health statuses: cmd (4987 images), cbsd (2997 images), and healthy (1119 images). The dataset was released in 2022 by the University of Ghana.

Explore #
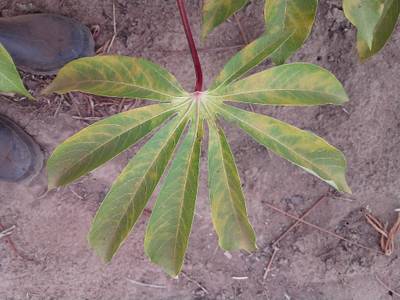
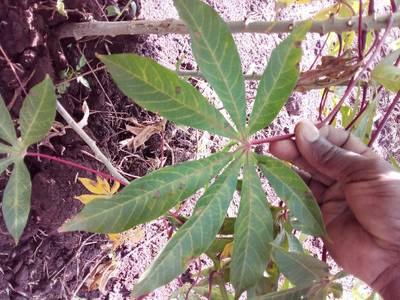
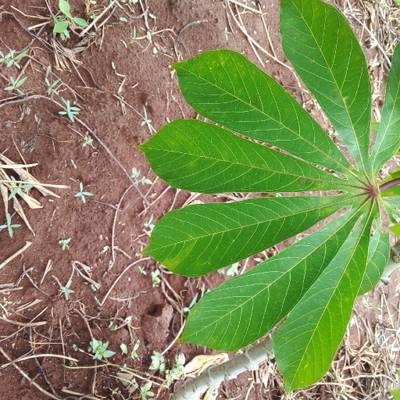
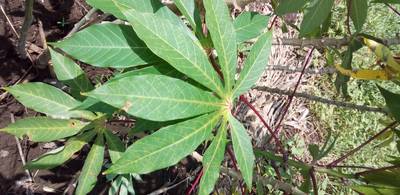
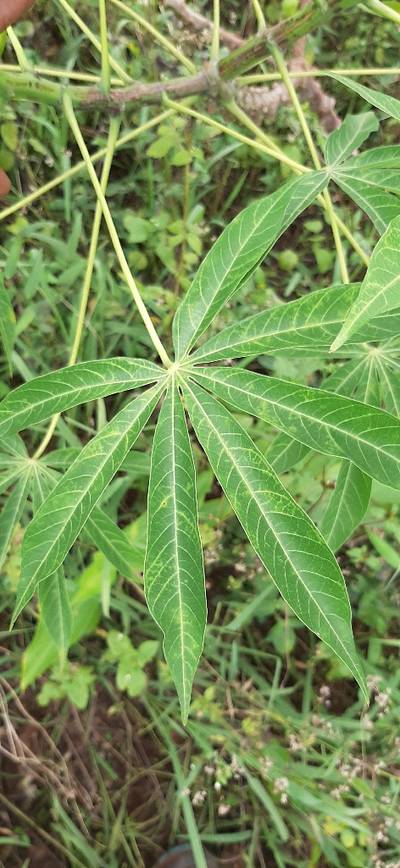
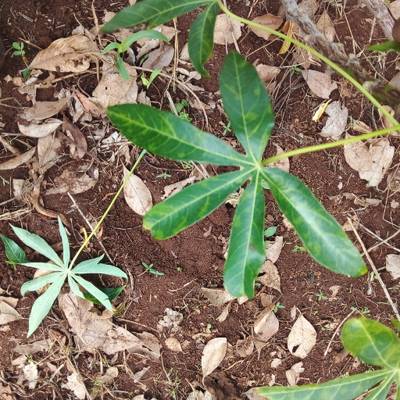
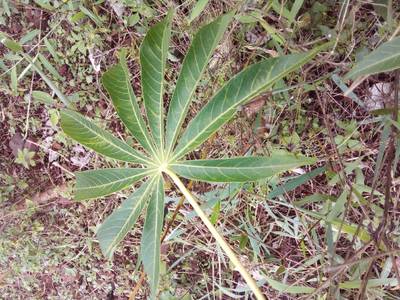
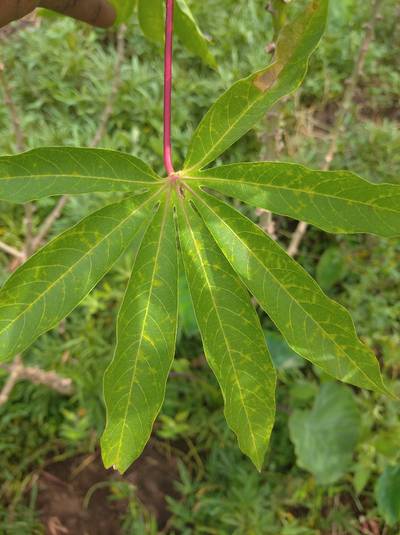
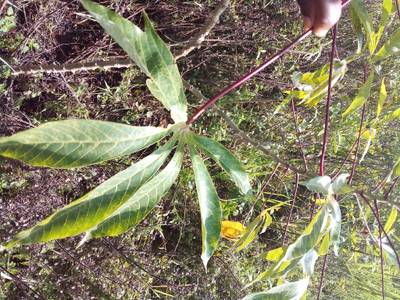
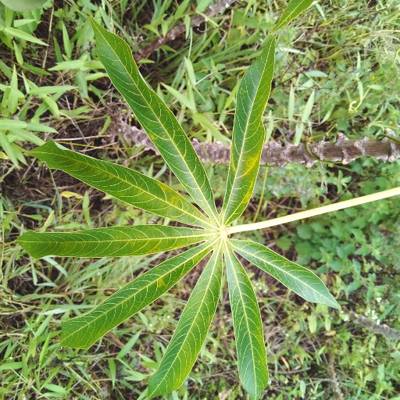
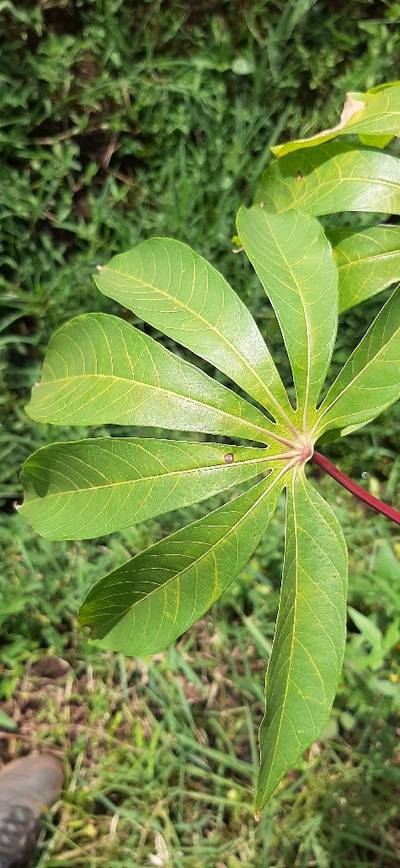
Makerere University Cassava dataset has 9103 images. Click on one of the examples below or open "Explore" tool anytime you need to view dataset images with annotations. This tool has extended visualization capabilities like zoom, translation, objects table, custom filters and more. Hover the mouse over the images to hide or show annotations.

























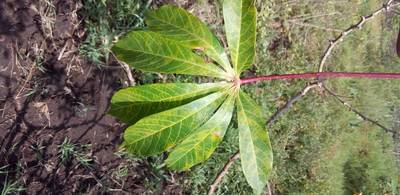


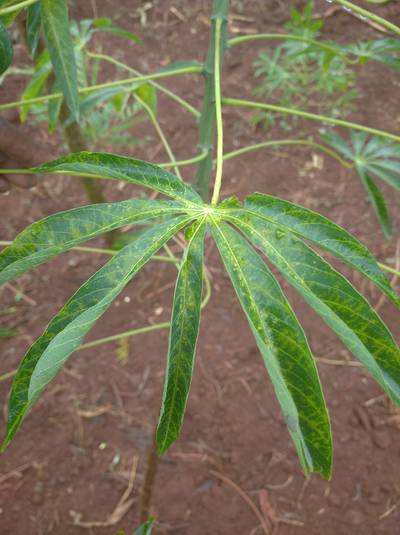

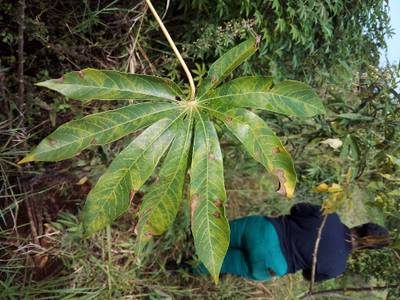
Class balance #
There are 1 annotation classes in the dataset. Find the general statistics and balances for every class in the table below. Click any row to preview images that have labels of the selected class. Sort by column to find the most rare or prevalent classes.
Class ㅤ | Images ㅤ | Objects ㅤ | Count on image average | Area on image average |
|---|---|---|---|---|
cassava brown streak disease➔ rectangle | 2993 | 3152 | 1.05 | 51.8% |
Images #
Explore every single image in the dataset with respect to the number of annotations of each class it has. Click a row to preview selected image. Sort by any column to find anomalies and edge cases. Use horizontal scroll if the table has many columns for a large number of classes in the dataset.
Object distribution #
Interactive heatmap chart for every class with object distribution shows how many images are in the dataset with a certain number of objects of a specific class. Users can click cell and see the list of all corresponding images.
Class sizes #
The table below gives various size properties of objects for every class. Click a row to see the image with annotations of the selected class. Sort columns to find classes with the smallest or largest objects or understand the size differences between classes.
Class | Object count | Avg area | Max area | Min area | Min height | Min height | Max height | Max height | Avg height | Avg height | Min width | Min width | Max width | Max width |
|---|---|---|---|---|---|---|---|---|---|---|---|---|---|---|
cassava brown streak disease rectangle | 3152 | 49.23% | 95.56% | 0.21% | 49px | 4.98% | 3902px | 99.4% | 817px | 74.79% | 34px | 2.91% | 3830px | 99.07% |
Spatial Heatmap #
The heatmaps below give the spatial distributions of all objects for every class. These visualizations provide insights into the most probable and rare object locations on the image. It helps analyze objects' placements in a dataset.

Objects #
Table contains all 3152 objects. Click a row to preview an image with annotations, and use search or pagination to navigate. Sort columns to find outliers in the dataset.
Object ID ㅤ | Class ㅤ | Image name click row to open | Image size height x width | Height ㅤ | Height ㅤ | Width ㅤ | Width ㅤ | Area ㅤ |
|---|---|---|---|---|---|---|---|---|
1➔ | cassava brown streak disease rectangle | 1617095881214.jpg | 1440 x 2960 | 1387px | 96.32% | 1983px | 66.99% | 64.53% |
2➔ | cassava brown streak disease rectangle | 1617105678858.jpg | 1024 x 765 | 739px | 72.17% | 681px | 89.02% | 64.24% |
3➔ | cassava brown streak disease rectangle | 1617171216111.jpg | 768 x 1024 | 758px | 98.7% | 657px | 64.16% | 63.32% |
4➔ | cassava brown streak disease rectangle | 1617092327111.jpg | 768 x 1024 | 498px | 64.84% | 707px | 69.04% | 44.77% |
5➔ | cassava brown streak disease rectangle | 1616821888559.jpg | 4032 x 3016 | 2619px | 64.96% | 2899px | 96.12% | 62.44% |
6➔ | cassava brown streak disease rectangle | 1617171819332.jpg | 1024 x 1024 | 879px | 85.84% | 784px | 76.56% | 65.72% |
7➔ | cassava brown streak disease rectangle | 1617103315023.jpg | 768 x 1024 | 423px | 55.08% | 595px | 58.11% | 32% |
8➔ | cassava brown streak disease rectangle | 1617103315023.jpg | 768 x 1024 | 114px | 14.84% | 122px | 11.91% | 1.77% |
9➔ | cassava brown streak disease rectangle | 1617172596937.jpg | 1024 x 1024 | 725px | 70.8% | 205px | 20.02% | 14.17% |
10➔ | cassava brown streak disease rectangle | 1617105346857.jpg | 1440 x 2960 | 1181px | 82.01% | 1559px | 52.67% | 43.2% |
License #
Citation #
If you make use of the makerere university cassava data, please cite the following reference:
@data{DVN/T4RB0B_2022,
  author = {Tusubira, Francis Jeremy and Nakatumba-Nabende, Joyce and Babirye, Claire and Okao-Okujja, Geoffrey and Mutebi, Chodrine and Mugalu, Ben Wycliff and Nabagereka, Deborah and Namanya, Gloria},
  publisher = {Harvard Dataverse},
  title = {{Makerere University Cassava Image Dataset}},
  year = {2022},
  version = {V1},
  doi = {10.7910/DVN/T4RB0B},
  url = {https://doi.org/10.7910/DVN/T4RB0B}
}
If you are happy with Dataset Ninja and use provided visualizations and tools in your work, please cite us:
@misc{ visualization-tools-for-makerere-university-cassava-dataset,
  title = { Visualization Tools for Makerere University Cassava Dataset },
  type = { Computer Vision Tools },
  author = { Dataset Ninja },
  howpublished = { \url{ https://datasetninja.com/makerere-university-cassava } },
  url = { https://datasetninja.com/makerere-university-cassava },
  journal = { Dataset Ninja },
  publisher = { Dataset Ninja },
  year = { 2026 },
  month = { jan },
  note = { visited on 2026-01-05 },
}
Download #
Dataset Makerere University Cassava can be downloaded in Supervisely format:
As an alternative, it can be downloaded with dataset-tools package:
pip install --upgrade dataset-tools
… using following python code:
import dataset_tools as dtools

dtools.download(dataset='Makerere University Cassava', dst_dir='~/dataset-ninja/')
Make sure not to overlook the python code example available on the Supervisely Developer Portal. It will give you a clear idea of how to effortlessly work with the downloaded dataset.
The data in original format can be downloaded here.
Disclaimer #
Our gal from the legal dep told us we need to post this:
Dataset Ninja provides visualizations and statistics for some datasets that can be found online and can be downloaded by general audience. Dataset Ninja is not a dataset hosting platform and can only be used for informational purposes. The platform does not claim any rights for the original content, including images, videos, annotations and descriptions. Joint publishing is prohibited.
You take full responsibility when you use datasets presented at Dataset Ninja, as well as other information, including visualizations and statistics we provide. You are in charge of compliance with any dataset license and all other permissions. You are required to navigate datasets homepage and make sure that you can use it. In case of any questions, get in touch with us at hello@datasetninja.com.


